
We have three trading weeks left in the year. I won’t rehash the many ways the second half of this year has pissed me off, but I remain bearish heading into the holiday season. As anyone who’s read my posts knows, regardless of supposed political positioning, macroeconomic events, whatever, I try to follow what the charts tell me. And the charts messaging to me has not changed all year, we are headed down for coming months.
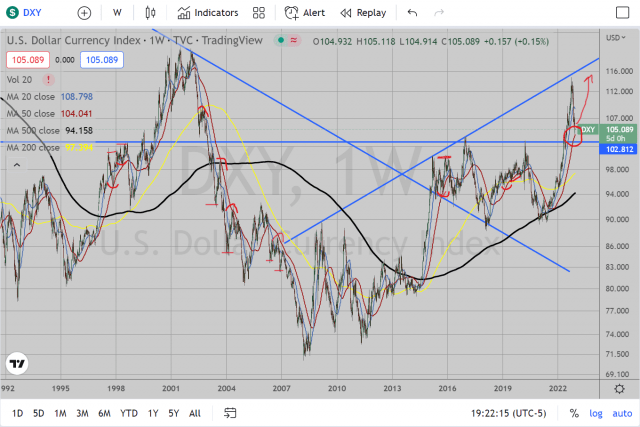
Part of my current thesis (specifically since June), relates to how much everything depends on the movements in the dollar in the short term (Tim did a post on the dollar last week, which made me take a closer look). I had noted the ascending trendline in the DXY chart in late September around 115 (in a throwaway comment, not any full post). Looking at the weekly chart, the dollar has had a pretty constant move upward since June 2021, followed by a significant pullback after nearing that ascending trendline from the underside. While this pullback has broken several moving averages on the daily chart, this has managed to make a pullback into the 50 Week EMA which remains untested.
When it comes to Moving Averages, I find that the best times to pay attention these is when something has already made a big move and bounces or pulls back as we have seen here. Once it pulls back to the average, I usually like to look for a bounce back to retest the recent move high (who is to say if it continues to breakout or stop short. Regardless, I tried to make notations of other past examples of when DXY touched this average and made continuation moves). But this setup portends a potential for a decent dollar bounce back up to the 115 area, which would not bode well for equities in following weeks and months.
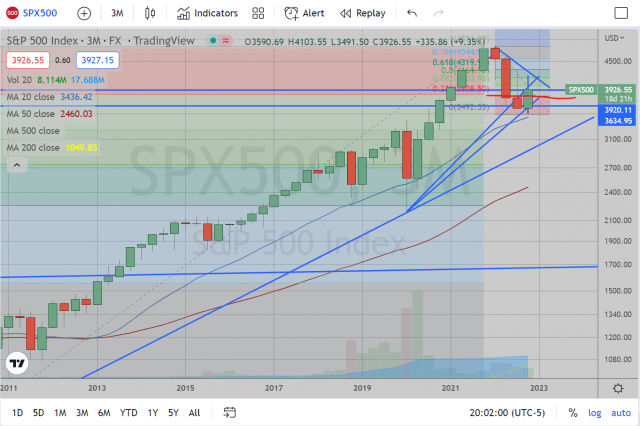
SPX500 Quarterly. I have noted in recent weeks that I am now paying attention to the Quarterly chart on SPX very closely. We managed to close 3 quarters in a row in the red. The last 2 times this occurred were 2001 and 2008. I don’t think this series of candlesticks make for a bullish 2023. In fact, this quarterly chart gives me a target in the next 3 weeks where I believe we could close December at the 3rd quarter open. I’ll come back to this.
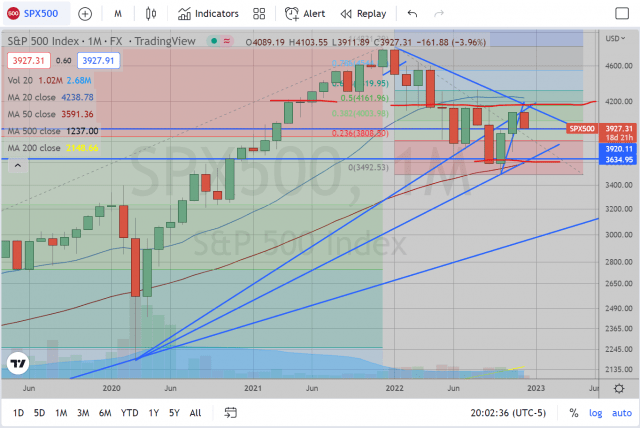
SPX500 Monthly. The monthly chart showed that while we had this very significant bounce since October, we still rejected the previous resistance very obediently. In fact, the months following April showed significant resistance around 4130-4150. Our recent rally couldn’t manage to break 4105. This is not to mention the dogfight between 3950-3960, which was the August low and close (this is all 2020 hindsight obviously). And now we have a chance to break down beneath November’s close to engulf that month, which in turn could lead to a bearish start to 2023 in January.
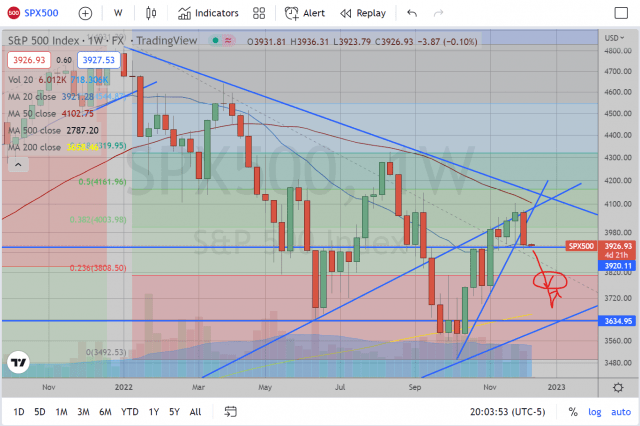
SPX500 Weekly. I’d say the most bullish potential can be seen on the weekly chart, though I still feel the bearish technicals outweigh the bullish ones. The bullish case is that we managed to close last week at 3930 and still stay above 3900-3920. This certainly scores one for the bulls. If this week can manage to bounce from here or even trade lower and bounce and close above 3930 then the technical bearish setup looks much worse. In fact, this could lead to further pain, bouncing back up to 4100-4120 to close out the year. Score two for the bulls.
On the other hand, Last week DID manage to engulf the prior 3 weeks and make the lowest weekly close since November CPI. Score one for bears. Secondly, this 20 Week moving average hardly looks like a solid supportive average. We broke beneath it after the August Peak fairly easily and last week’s close didn’t seem to send the message that buyers were eagerly waiting at this area to get long. Rather it feels more like quicksand and a last grasp at support. Score two for bears. Still, we won’t know for sure until this week ends as this looks like a make-or-break area. So it’s a tie for Bulls/Bears on the weekly chart.
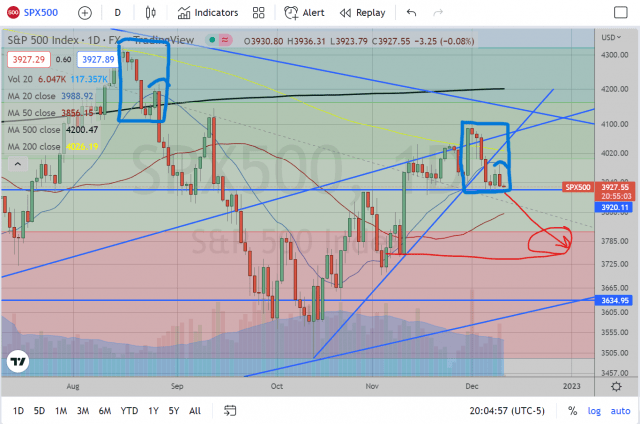
SPX500 Daily. The biggest bullish technical setup I can see is simply the breakout level of 3920 trying to hold up. Everything else looks bearish to me. November reached a lower peak than August and we are barely able to escape this breakout zone. The setup leading up to the August 25 drop (based on jobless claims numbers) looks very similar to the setup off this recent peak. The only thing missing from this pattern is the final drop beneath 3900 to clinch this move. Note, however, that a break above last week’s high of 3987 would again start causing some havoc to my scenarios I laid out here.
To sum up, I am bearish as ever. There are a lot of little potential setups for fluctuations, but I think the dollar has potential for a run back up and equities look tired. The short-term lines I am seeing are the recent resistance last week at 3987 and support at 3920. A break beneath 3920 leads to potential down to 3780 to close out the year. Really, any close near 3800 I would consider a success as this would close the quarter at the 3rd quarter open and it would also COMPLETELY erase the entire November 10 rally which I think would be the definition of poetic justice. Good Luck to all this week and in the coming weeks.
