A funny correlation has popped up in the market. The S&P 500 Index is moving positively with the 4-week average of continuing unemployment claims because the QE-addicted bulls are pining for a Fed pivot.
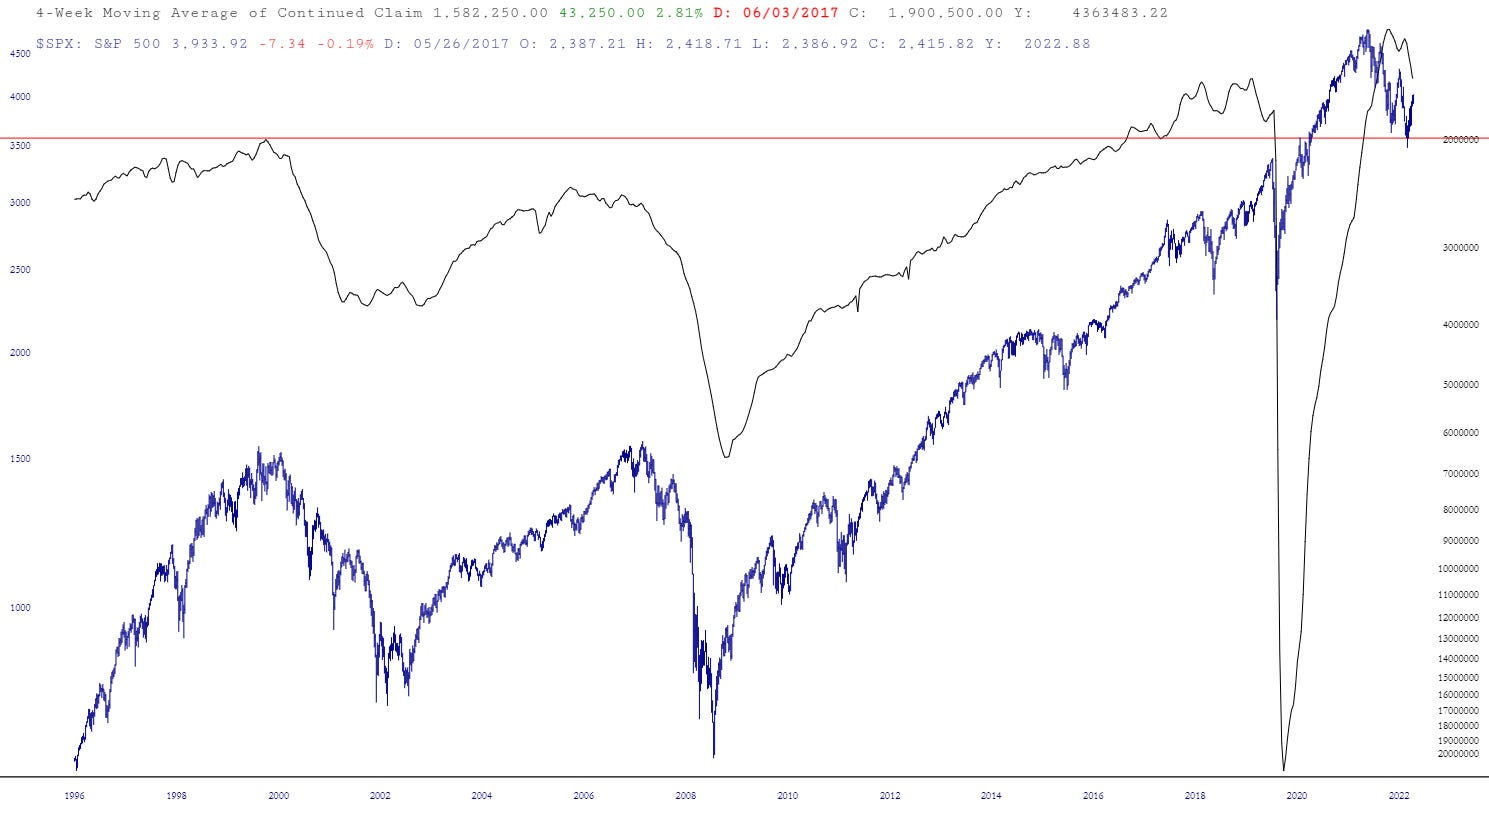
This is not the longer-term relationship. On the chart below, I’ve inverted unemployment claims. Alligator jaws are opening as claims tick higher (the line dropping on the chart) and stocks move higher.
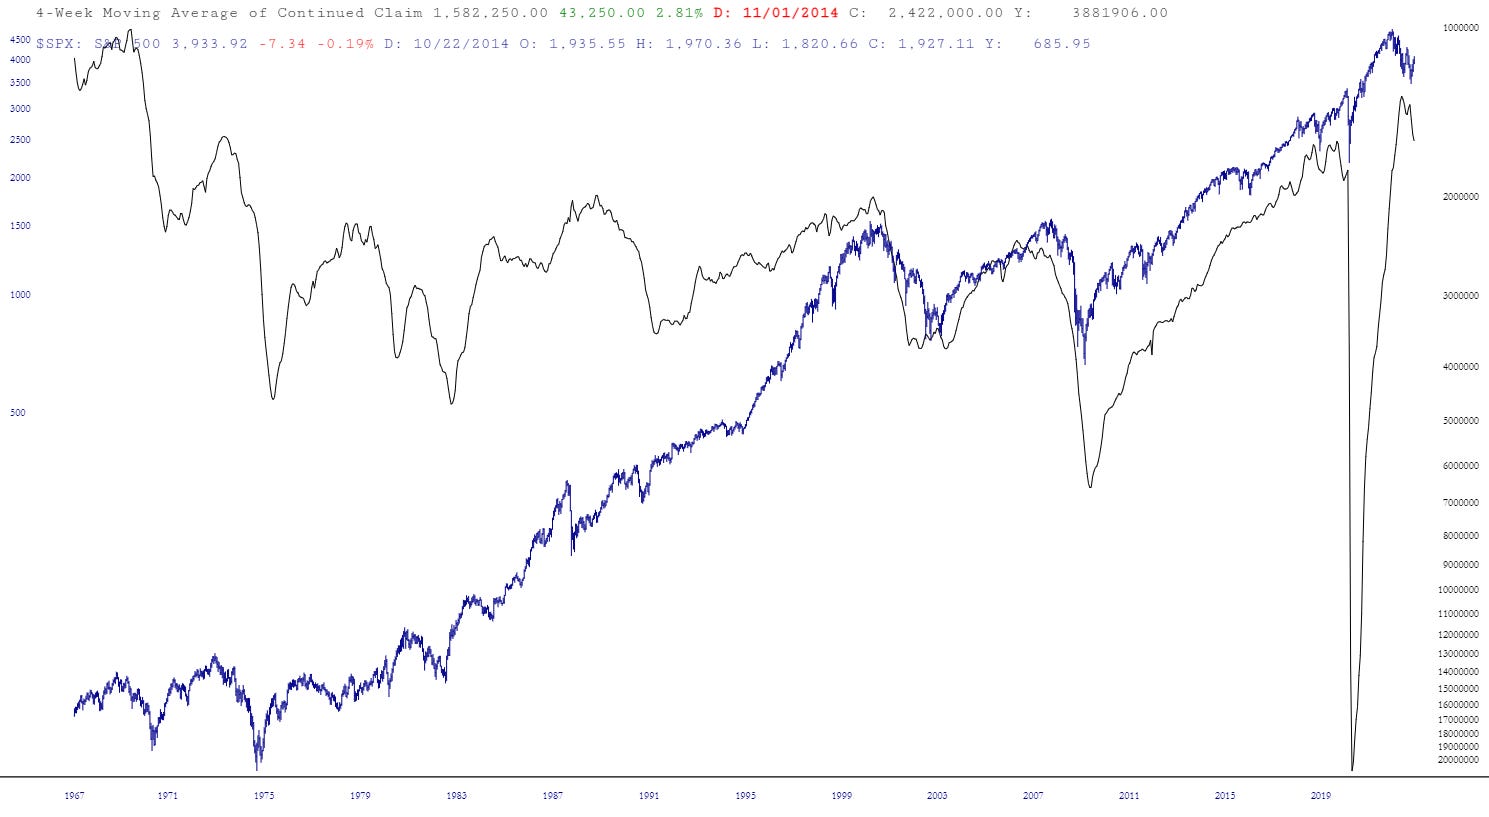
Here’s another chart showing the recent past. The 2000 peak in employment led the market by four months. Tech had popped before unemployment bottomed in May, but the overall market held up into September.
The 2006 peak in employment didn’t immediately give way to recession. Employment started falling sharply after October 2007, coincident with the stock market top.
People may not believe it, but the markets were sending lots of signals for a major bear market or decline in 2020, long before coronavirus showed up. Employment peaked in September 2019, the same month that the Fed started stealth QE with its repo operations.
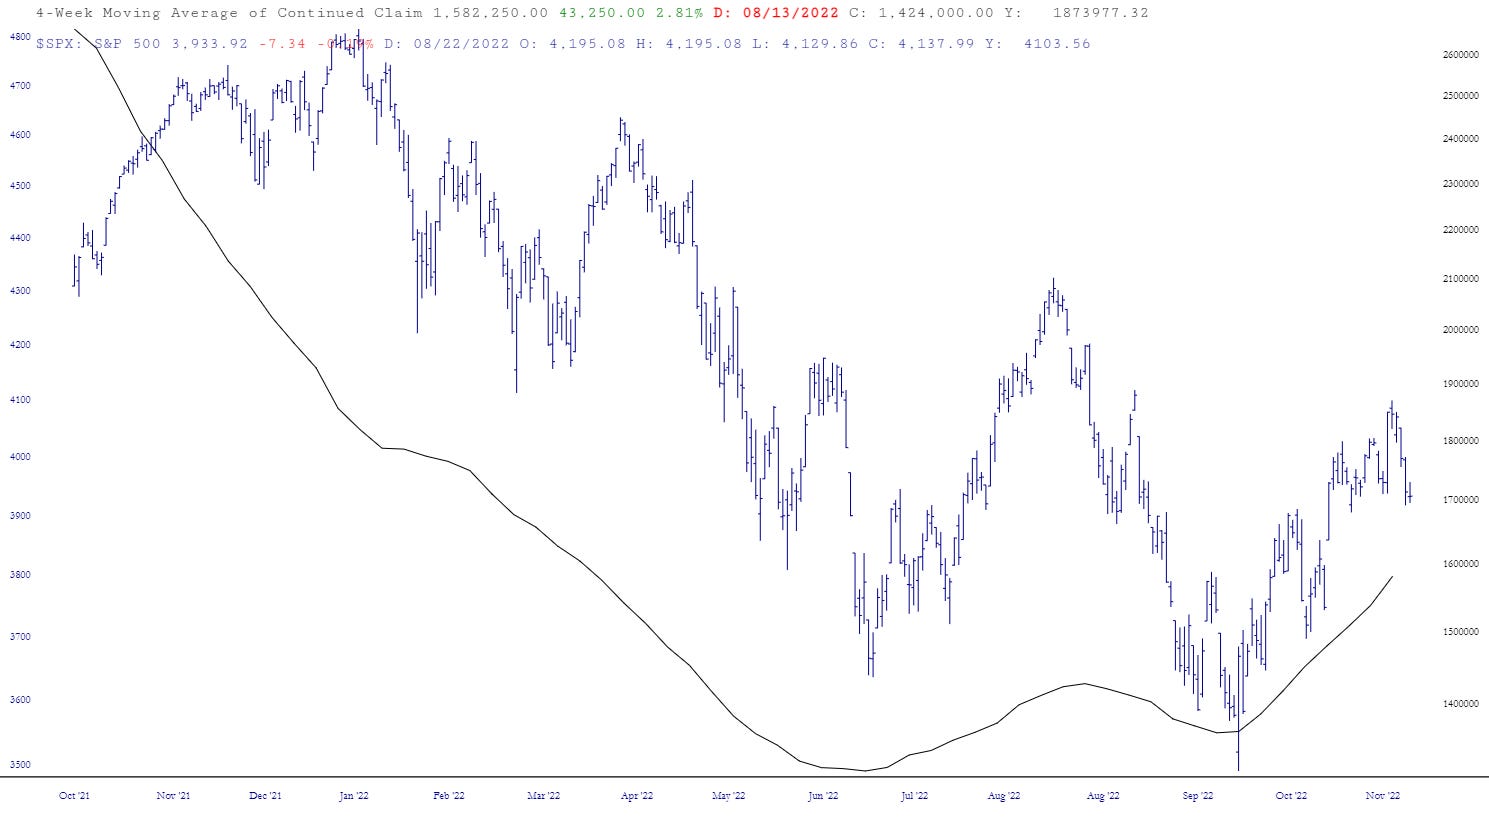
Employment peaked again in May of 2022 and started falling sharply in October.