
First off, thanks to The Lone Ranger for inspiring this post in the first place.
And now let’s begin…
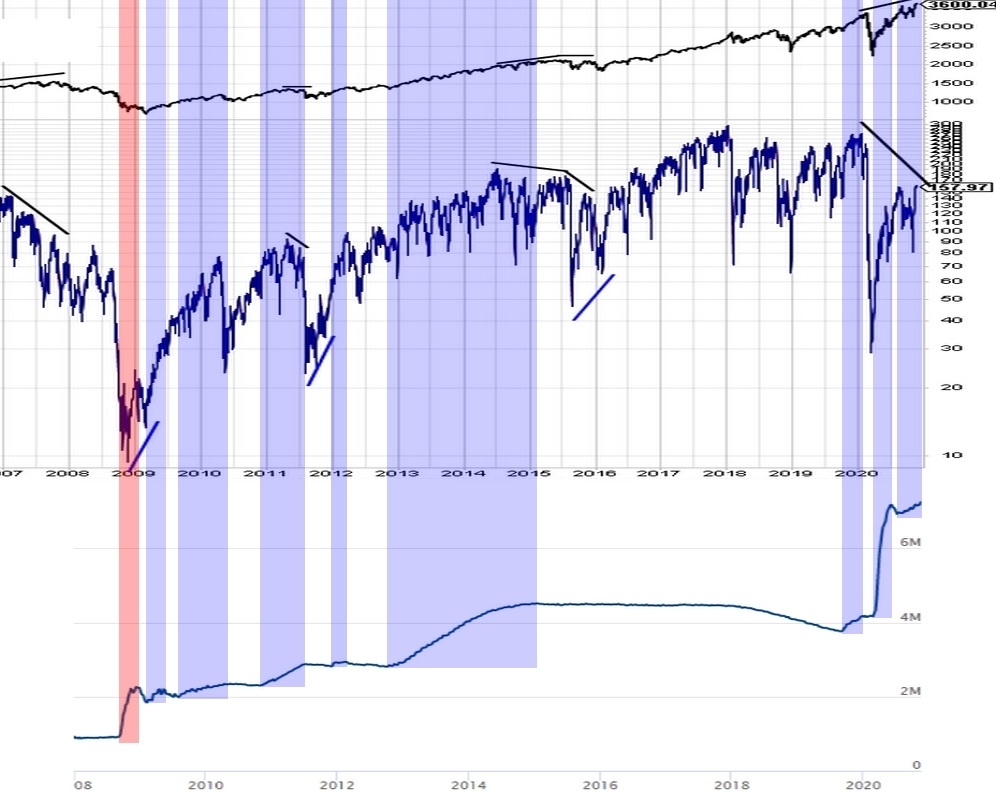
Starting with the bird’s eye view, the chart below shows all available data on the FOMC’s operations going back to 2007 (for a more detailed explanation with chart of all the FOMC operations current to Apr 2020, check out this excellent post I found here).
Except for the period between 2015 and the end of 2019, virtually all of the market gains were concurrent with FOMC operations. I will focus in this post on the periods of high complacency as identified by extremely high levels of the 100SMA (20wk SMA) of the Equity Put/Call ratio. If you want to read those posts, the first is here and the second is here.
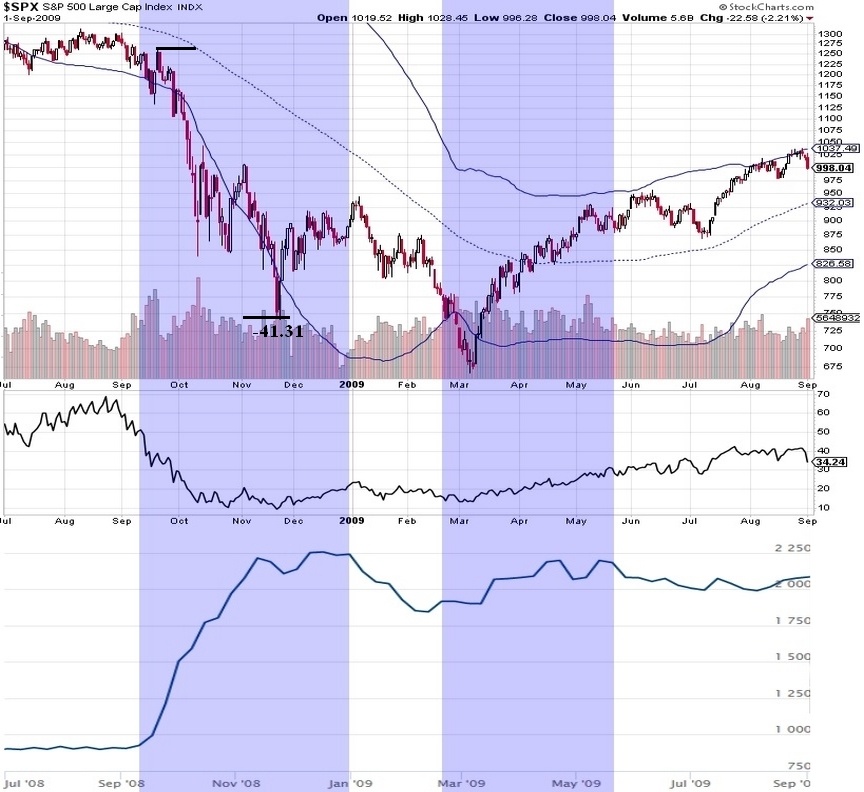
2008 (below): There was actually not enough Fed data to go back to the first complacency signal (2007) from my other posts, but I will include 2008 here just to show the Fed’s influence on the stock market at the time when it began active buying programs. Please also note that this chart is well past the complacency reversal in 2007 (by about a year). Fed buying wasn’t so helpful in September through November, was it. Admittedly, a rare occurrence.
2010 (below): Note that this is also NOT a true signal from the high complacency area because there was no negative divergence in the $SPX:$VIX ratio (though the Equity PCR did reach the complacency warning level). I wanted to include it only to show the result of the fed spigot even being threatened of being turned off. Two months prior to the Fed’s Balance Sheet declining (though there is a notable slowing), there was a -17% price correction. I take this outcome with a little grain of salt because this was the Nav Sarao crash known at the time as the Flash Crash. Since it was influenced largely by one trader, I’m not sure how reliable this outcome really is. So…grain of salt.
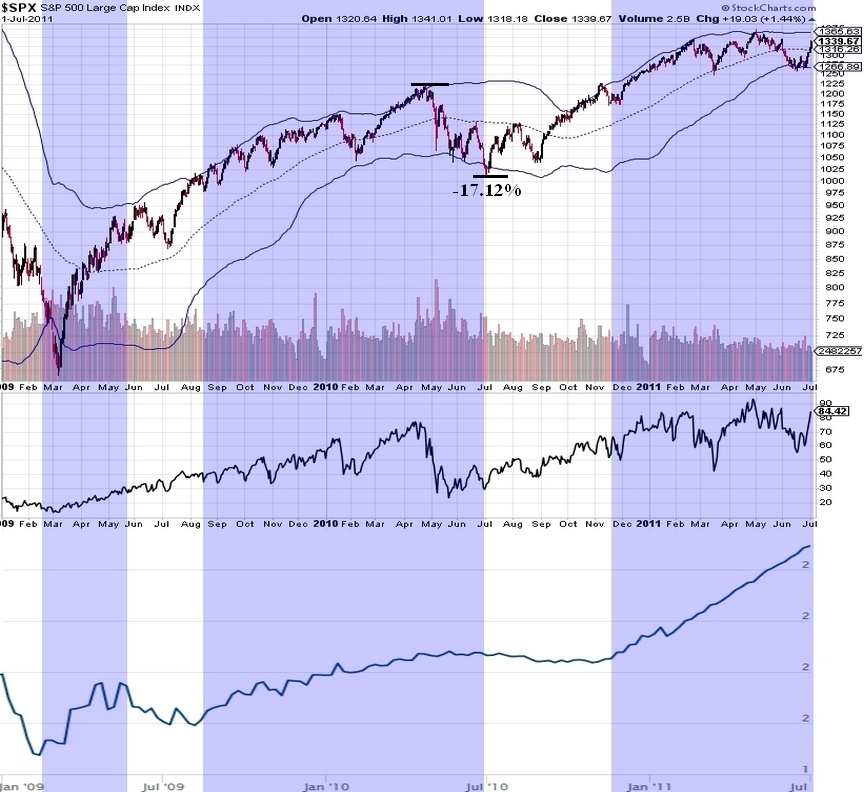
2011: It’s pretty easy to see the FOMC influence in this chart. Without Fed cash sloshing around, price was far more prone to sharp pullbacks and rangebound trade. Though again, note that months before Fed buying stopped, price started to trade rangebound. The Complacency Reversal Trade occurred in July 2011 promptly delivering -18% just as Fed buying stopped.
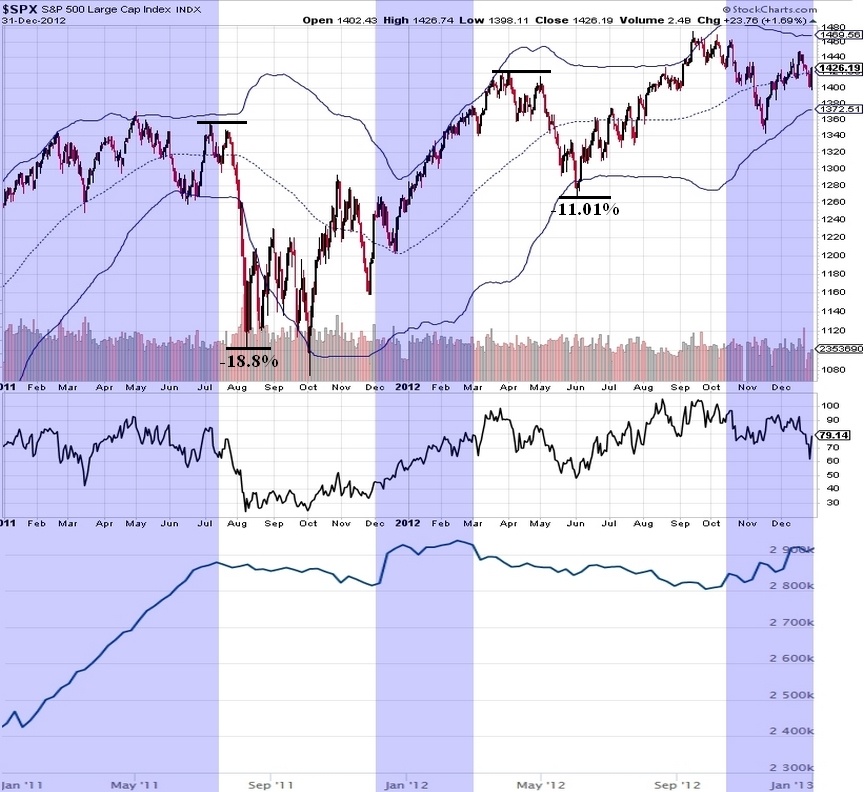
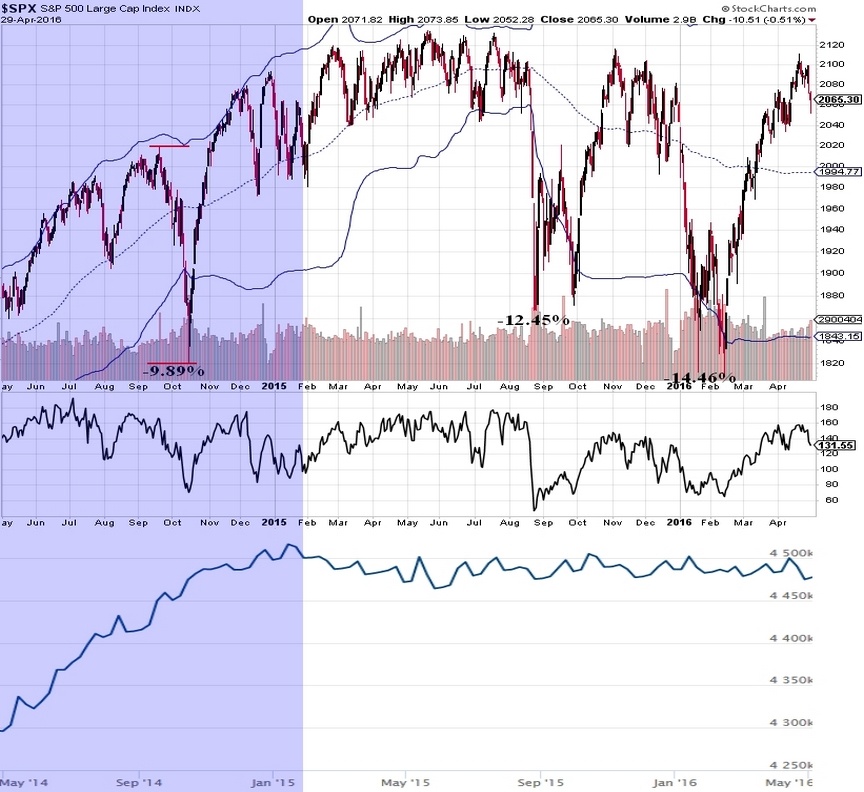
2015: Fed buying stopped in early 2015. Price could not advance here either for any significant gains, mostly chopping around for six months. Then in August there was a horrificly fast -12% followed by the $SPX:$VIX negative divergence in November delivering another Complacency Reversal Trade for -14.46%. See that nearly 10% correction in Oct 2014 four months before Fed buying stopped?
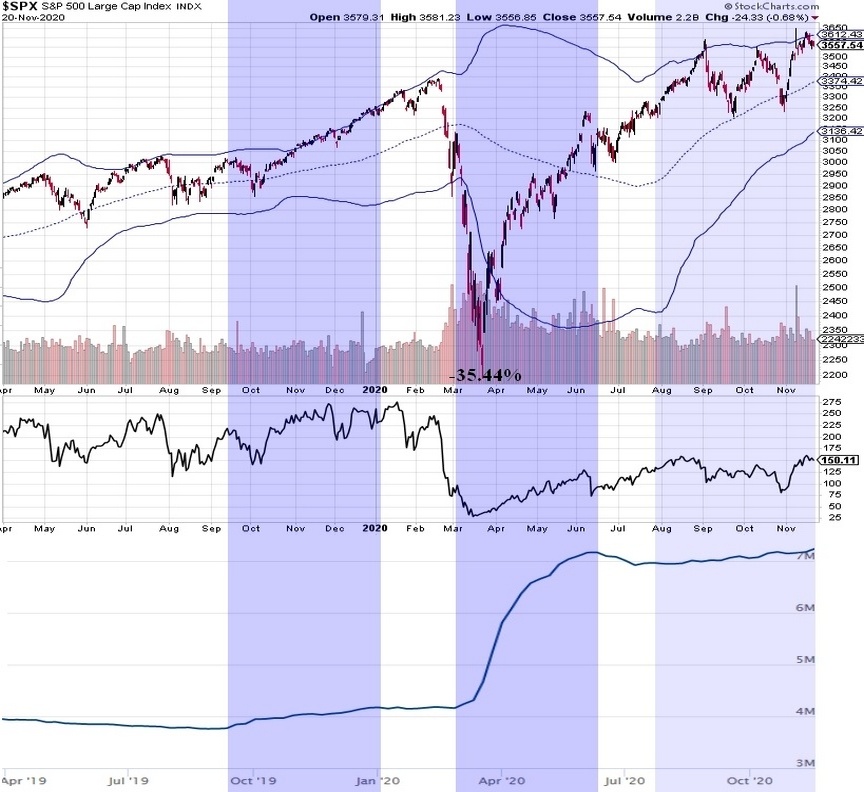
2020: This brings us all the way to the present year. Again, high complacency occurred in February with a sharp $SPX:$VIX negative divergence in February delivering a -35.44% trade.
Looking over these charts, I have just a few observations on the effects of Fed Balance Sheet growth around high complacency periods.
- While price often moved in tandem with balance sheet growth, it was not a guarantee of advancing prices and sometimes there were dramatic selloffs and large, swingy price ranges in spite of Fed Balance Sheet growth.
- The indices did pretty well from 2016-2018 even without Fed buying.
- Generally, the market did not like it when the Fed stopped buying and responded dramatically when there was also high complacency.
- When prices did turn, they were often violent and every one cut through their weekly Bollinger Band low.
The Fed balance sheet has been growing very slowly since July (note the timing of the June pullback and the Fed balance sheet shrinking). Now the current outlook is for the Fed to pull back significantly on support just after Christmas.
Time will tell how this high complacency period resolves itself.
Note: I got the Federal Reserve data for FOMC Operations Balance Sheet history here and the current scheduled buying program dates are here if anyone would like to review or keep tabs on themselves.
Finally, a short disclaimer. I am not an expert on market operations or the Fed or how the system works. This is my limited understanding take and could be well off the mark. I welcome any criticism or fill-in-the-blanks information that might shed any more light on these influences.
Have a great week!
