
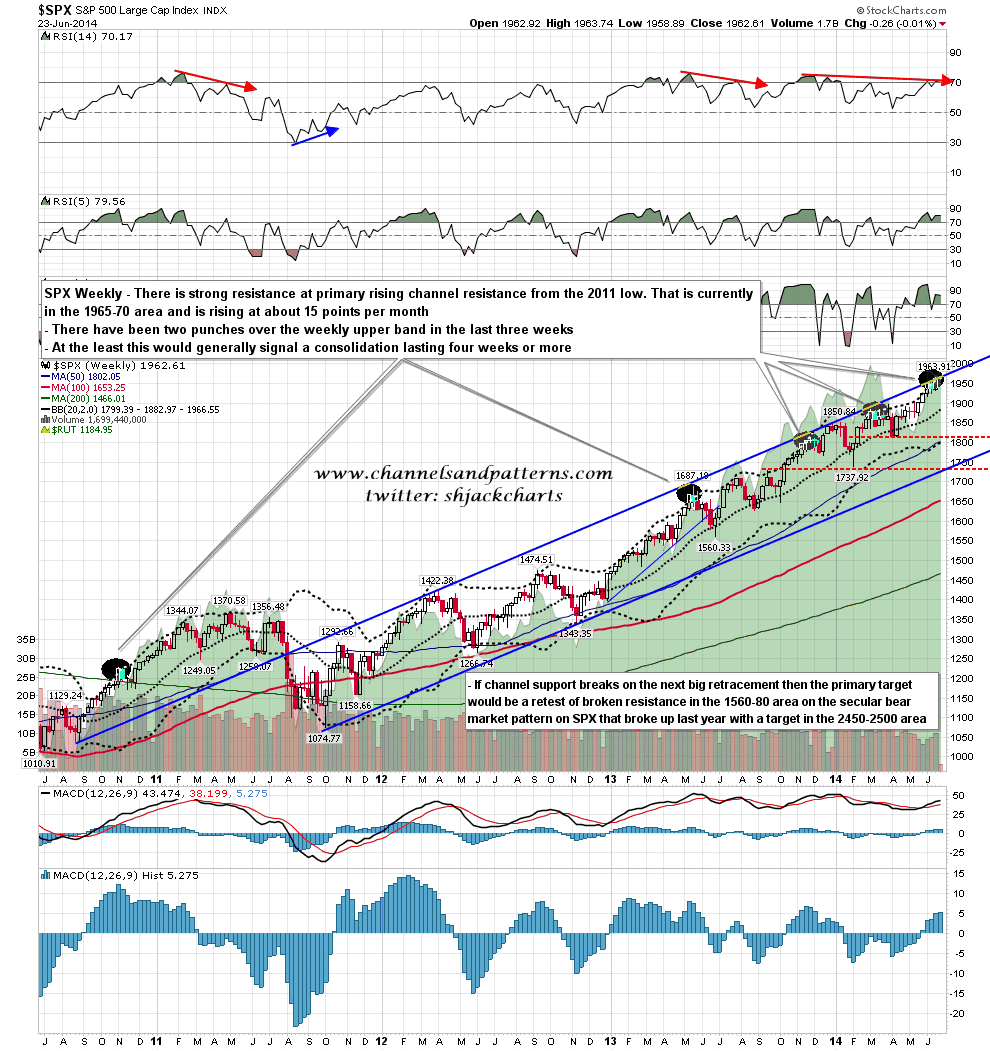
On the FOMC stats I was looking at last week, of the four similar instances since the start of 2010, and of the three of those that topped in the next few days, one topped on the Monday afterwards, and the other two topped on the Tuesday. If we are to see that intraday high today my target range is in the 1965-70 area and that would respect resistance on the primary rising channel on my weekly chart below. SPX weekly chart:
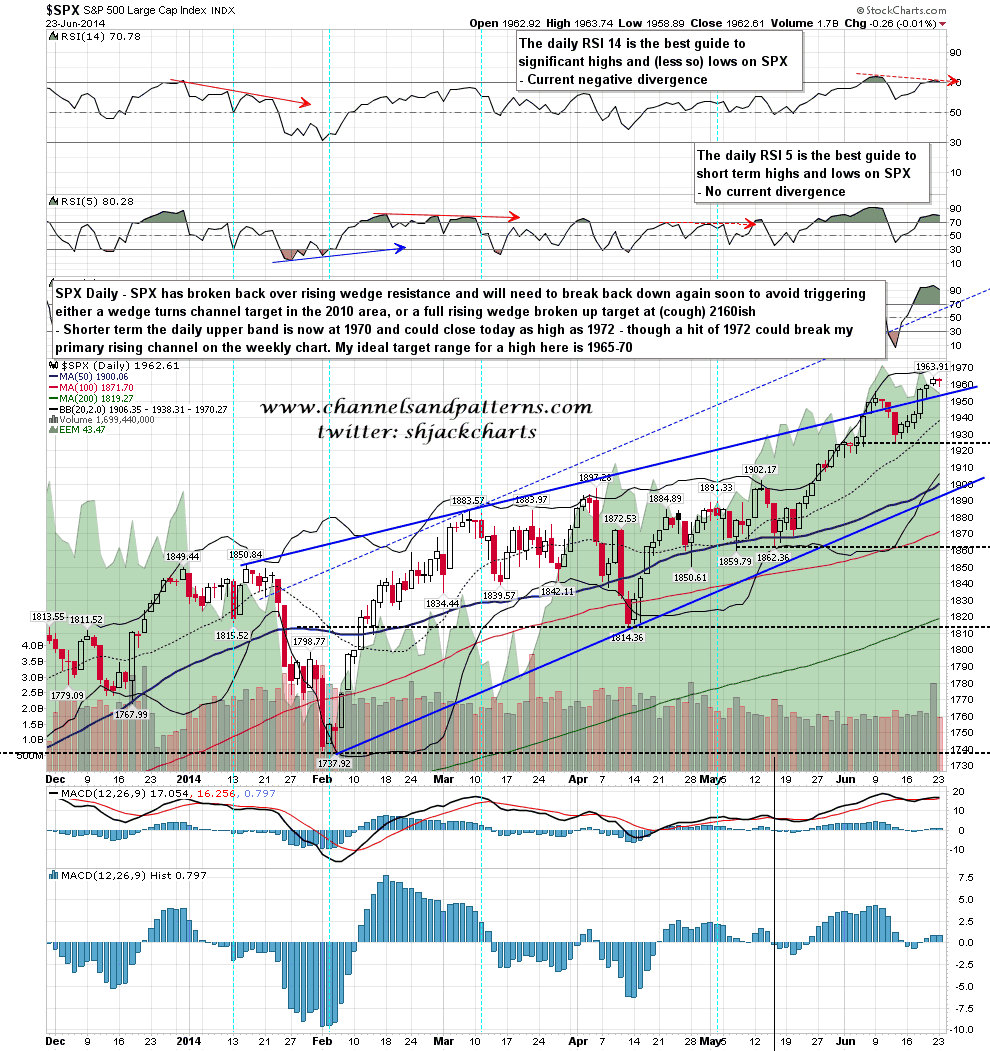
The daily upper band is now at 1970. With the close yesterday at 1962 that shouldn’t close higher than 1973 today and we might see a close enough intraday hit to be a visual hit of the upper band. SPX daily chart:
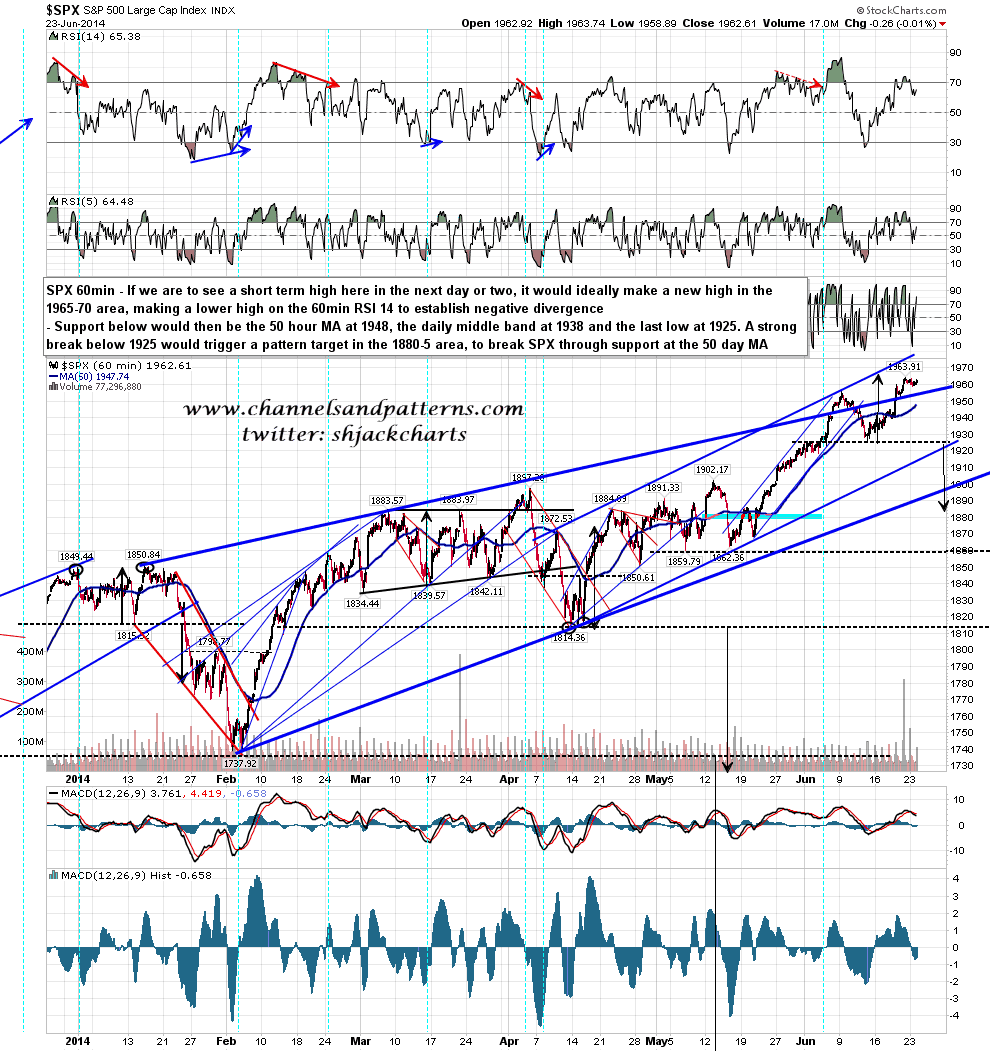
My ideal topping range would be 1965-70 as that would make my wedge targets, and I’ll be concerned with any move over 1970 that my channel resistance might be in trouble. From a technical perspective that should be a higher high on SPX with a lower high on the hourly RSI 14. I’ve listed the obvious support levels and targets on the chart below. SPX 60min chart:
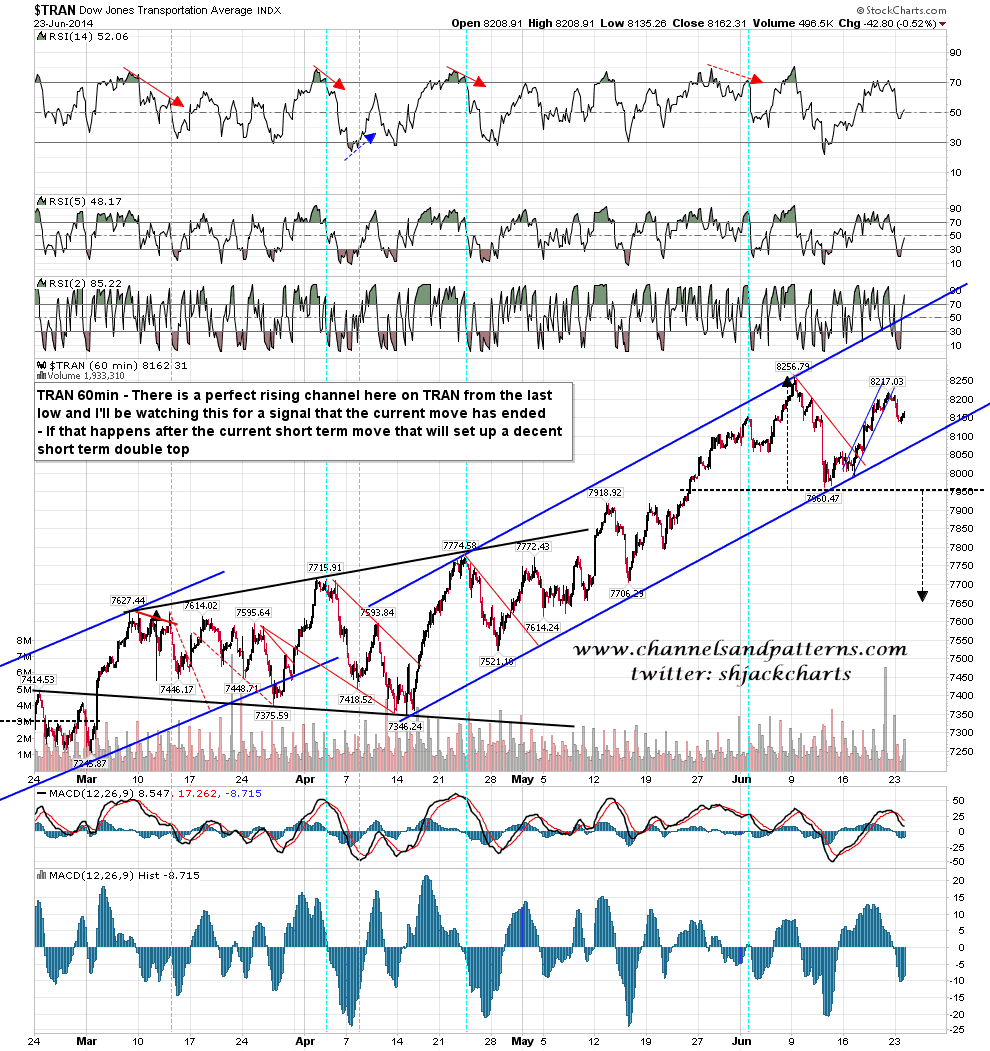
For an ideal double-top on TRAN I’d like to see that go a little higher too, though that’s not required. A break below this rising channel should be a signal that a retracement on SPX should reach at least 1925 double top support. TRAN 60min chart:
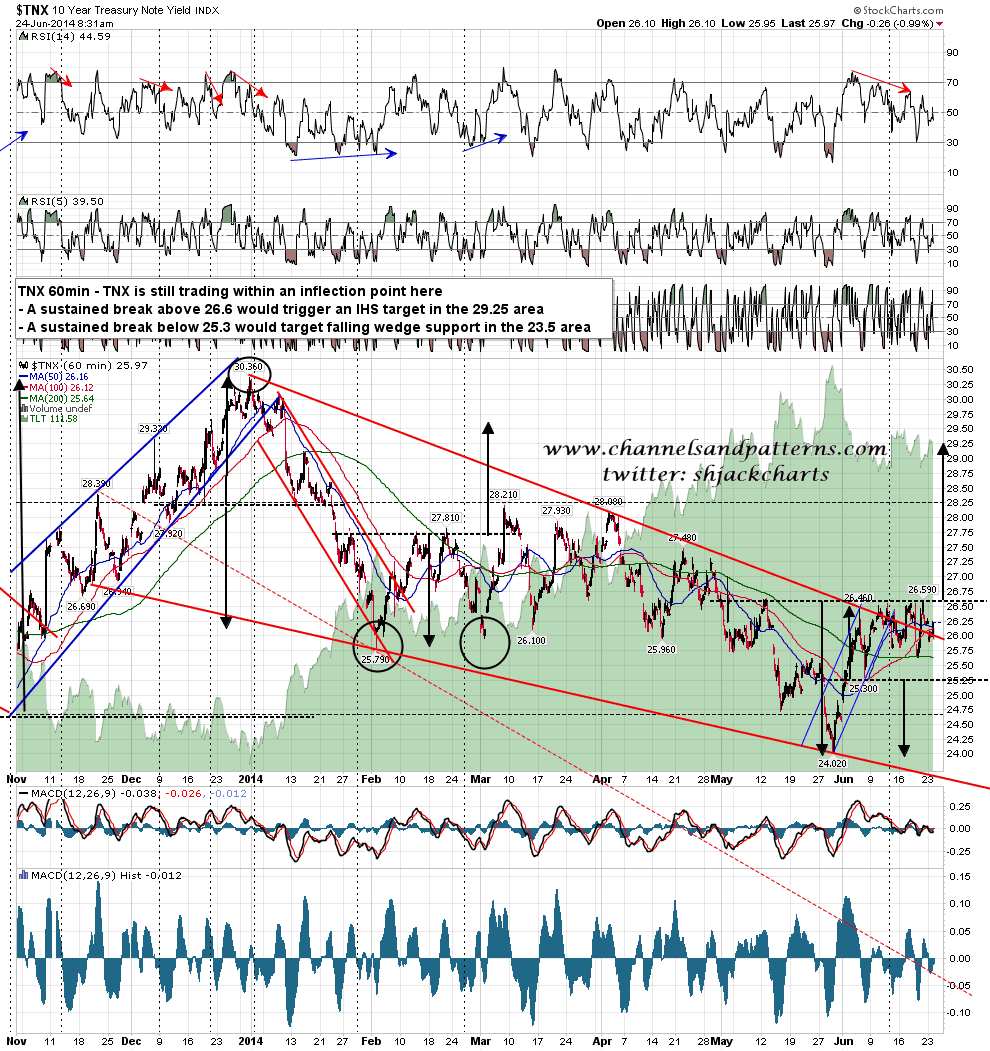
I thought I should post an updated TNX chart, even though nothing much of interest is happening at the moment. TNX is currently pinned in an inflection point. A sustained break above 26.60 will trigger an IHS target in the 29.25 area, as well as the wedge target at a retest of the 30.36 high. A sustained break below 25.30 double top support should deliver a test of the last low at 24.02, and very possibly a test of falling wedge support in the 23.50 area. TNX 60min chart:
Everything looks lined up today. ES has been trading below the 50 hour MA, suggesting that we are at an inflection point which may well be a reversal area, and the ES 60min RSI is looking for a higher high short term. Overhead resistance looks solid and the timing is right, there is a decent chance of making a short term high today, and if a surviving bear can be located to take advantage of that, then this might well be a significant high leading into a retracement that can be seen without the aid of a microscope. Don’t bet the farm on that however, the bears have disappointed very regularly in recent years.
I didn’t have time to finish my precious metals post yesterday afternoon. All the charts are done now however and it will be out this afternoon without fail.
