Washington D.C. US-EU meeting tomorrow
"Global QE3 will get me re-elected, and keep you guys in business….ok, let's do it! Ready for some lunch?"
Slope initially began as a blog, so this is where most of the website’s content resides. Here we have tens of thousands of posts dating back over a decade. These are listed in reverse chronological order. Click on any category icon below to see posts tagged with that particular subject, or click on a word in the category cloud on the right side of the screen for more specific choices.
Washington D.C. US-EU meeting tomorrow
"Global QE3 will get me re-elected, and keep you guys in business….ok, let's do it! Ready for some lunch?"
The 2-year monthly ….waiting for a monthly close under the red trend line….

The 2-year daily closeup in a bull flag but under monthly trendline….
The 2-year in general=Neutral

The 5-year Treasuries still at resistance, and look at its RSI. Either break higher or fall.
5-year: 1 Neutral point.

10-year Monthly.There are currently 2 possible charts that the market is looking at, which both are in parallel channels. The first one below looks bullish for bonds …as it looks like a breakout in August and a retest of support on Oct.

And this is also the second possible chart, which looks a little more bearish as we have not had a monthly close over the resistance. So overall 10-year for me is neutral.

Next is the 30-year. On the quarterly it certainly looks bullish for bonds..However what's not to say we can get a quarterly reversal as monthly closes keep repeating from bull to bear. And recently on the daily timeframe, we got an interesting dilemma. Notice how on the regular chart we broke resistance but the RSI looks bearish. I went long TMF on a breakout of the regular chart, but once the RSI told me to sell as of Thursday's close(Thanksgiving), I sold it on Friday's open.We could get a retest on the regular chart, but until the market internals tell me we broke resistance for sure…I am not playing TMF.
1 Neutral Point.

The European Bond market is starting to show signs of weakness as well.This is the Euro Bobl. Daily looks weak, but weekly still has not confirmed the breakdown.
So this gets 1 bullish point.

Euro Bund breaks first trendline support. Trendline 2 up next.
Bullish point 1.

The Sanjew/Sanjuu Index is also still at resistance. Again each time we hit this resistances, bonds have sold off hard. However as I repeat, we are still consolidating around this resistance…so there is a possibility we could break this resistance which will be a very deflationary signal and I will be going back long TMF. But until we break out of this resistance, I am not playing the 30-year Treasuries.

And the Sanjew close up. Notice the consolidation instead of a sharp fall. The last time we hit this we got the Oct 4th kill the bears signal. But once again s hort term support has not broken yet, so this gets a neutral point as well.

Mini Atomic broke out of resistance. Bearish point #1

The Atomic Index. Bearish point #1.

The Sanjew5 Index holds resistance and breaks short term support.
Bullish point #1.

End Game Index touched resistance….and looks like it might retest….A breakout would be pretty deflationary. But for now 1 neutral point.

CHF/USD self explanatory.

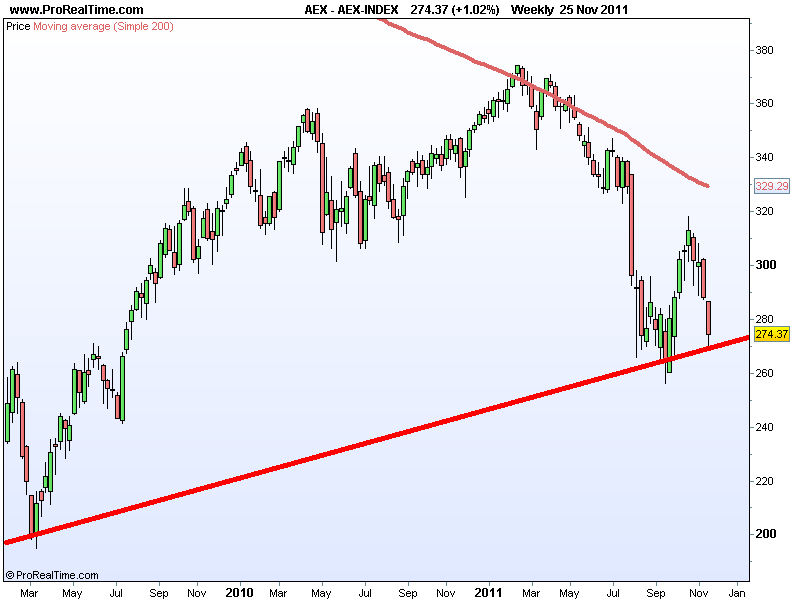
AEX-Index. I am and will be using the same method of charting for most of the other indicies. This will be the weekly lowest closes. Neutral point 1.
All Ordinaries Index. Neutral point 1.

AMX-Index breaks the march low to Oct low as mentioned in last weeks report. But let's see what the market could do with the given chart. Will we also break below the 07 peak trendline?
Neutral point 1.

Bel 20 Index. Sayonara France. Gets 1 bearish point.

Dow Jones Asian Titans..Support Much? Could rally or fall so neutral point 1.

Dow Jones China 88 Index Weekly in Log, Linear, and closeup on linear. BEARISH point 1.


FTSE Euro Top 100 Index. Neutral Point 1

FTSE MIB Index…1 neutral point.

NIKKEI 225 weekly…There seems to be some parallel possibility but a break below would be very bad. Neutral for now.

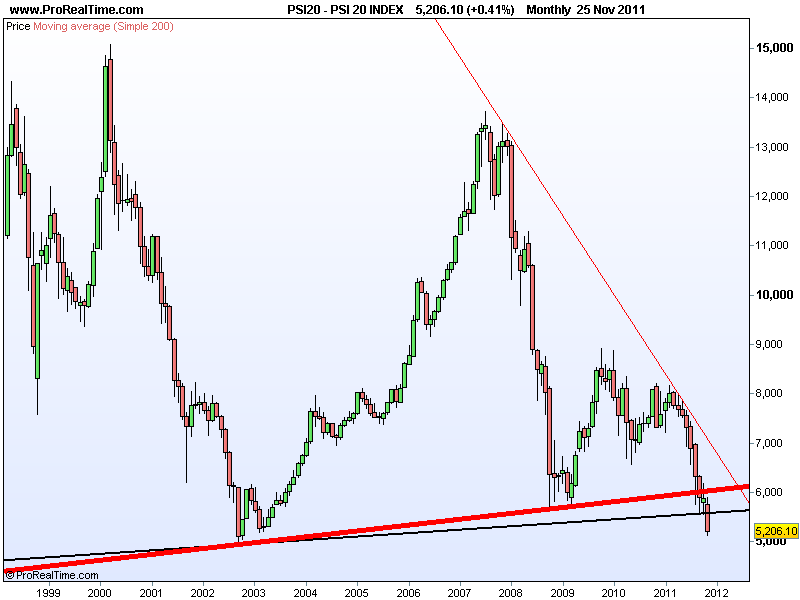
PSI 20 Index aka Portugal. Bearish much? I need a 10x leveraged Portugal ETF pronto.
Bearish point 1.
S&P500 Weekly RSI=bearish point 1

Mini Evil index weekly RSI is at an interesting point…Neutral for me for now

S&P500 Utilities..neutral for now.

GC Index. Neutral

Black Gold Index. Notice the circle area….very irritating for bears to say the least. But we held and rose which means oil took a hit.

Evil Index breaking back above the middle line..Bearish point numero uno.

Arab Index consolidating on channel support.

Gold/Silver Ratio. Each time we hit the resistance, it was a great entry point for silver, but if we break above it, I would short silver.

Trump Card makes me worried…bearish point 1.

And lastly the US dollar index weekly. If this breakout is real 84.812 is the next target as the last fib target was spot on surprisingly. Bearish point 1.

Time to add up all the points.
Bullish: 3 Neutral: 16 Bearish: 8
Of course these are biased in a way depending on the amount of samples and perspective…but if the analysis is correct…I will be going in neutral leaning bearish but opened to bullish, depending on which way the neutral charts change into.
If I had a million dollar portfolio….. I would be long dollars, short bonds, short financials, short gold, short silver, long volatility, and short China. I included bond shorts because bonds are starting to show signs of weakness and can hedge a part of the risk in all the other bearish plays. My gut feeling is we will break Oct low but keep an eye on bonds as there is something fishy going on…Hopefully next week can confirm the direction.
If you like this analysis, please visit me at http://heavenskrowinvestments.blogspot.com/
Greetings Slopers,
Just a quick post today with a simple weekly SPX chart. It's hard to say what will happen this week, but it should provide some much needed answers. Take a look at the chart…
