
I apologize for the length of my post, but I had a lot to say…thanks for bearing with me!
Further to my last weekly market update, this week's update will look
at:
- Weekly charts and graphs of the 6 Major Indices and 9 Major Sectors
- Quarterly charts of the 4 Major Indices
- Daily charts of the 4 E-mini Futures Indices
- 2 Daily Volatility Ratio charts of the S&P 500 and Russell 2000 Indices
- Daily charts and a Weekly graph of Commodities
- Daily charts and a Weekly graph of the Major Currencies
- a Weekly chart of 30-Year Bonds
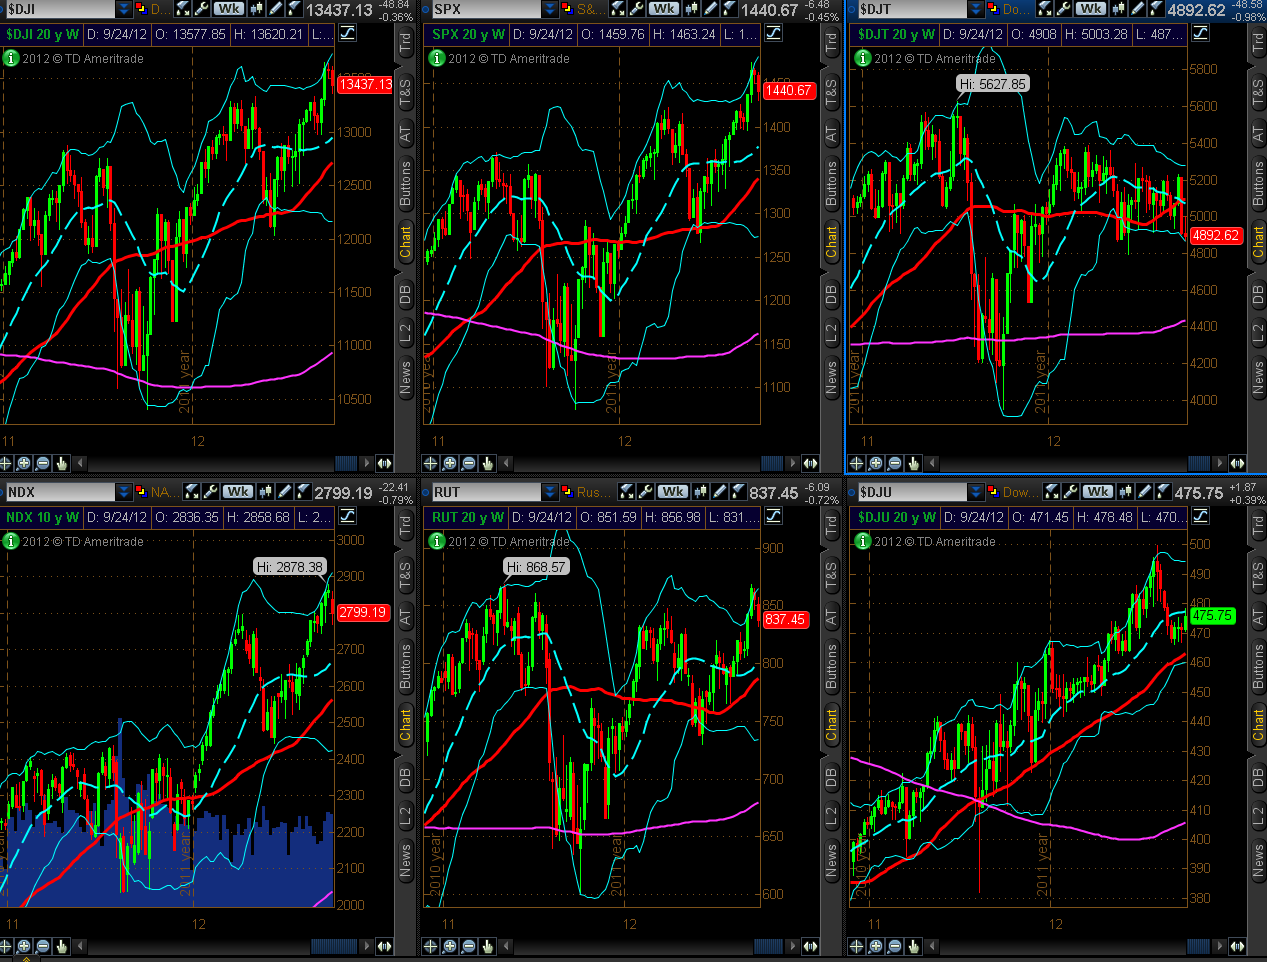
As can be seen from the following
Weekly charts and 1-Week percentages gained/lossed graph of the
6 Major Indices, there was a second week in a row of
profit-taking on all of them, except the Dow Utilities. The Nasdaq 100 and
Russell 2000 were hit the hardest…two to watch to see if they lead the way
down on any further weakness going forward into October.

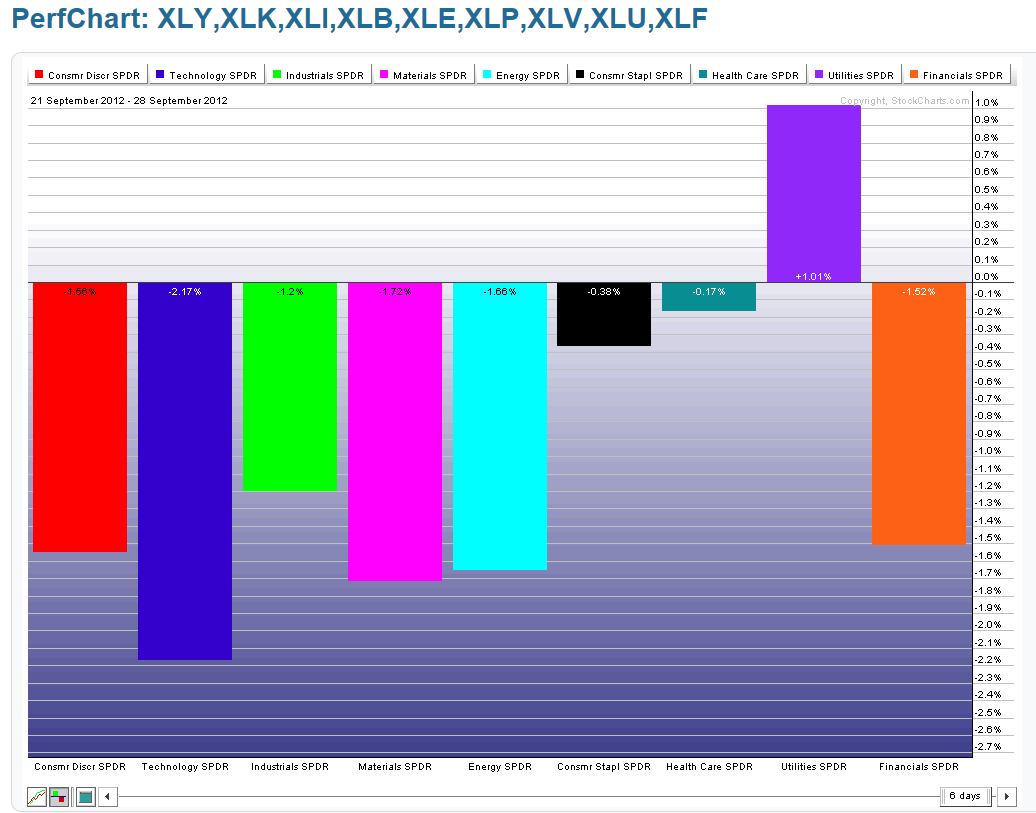
As can be seen from
the following Weekly charts and 1-Week graph of the 9
Major Sectors, profit-taking occurred in all of them, except in
Utilities. The largest losses occurred in Technology, Materials, Energy,
Consumer Discretionary, and Financials. It was largely a "risk-off" week. As
most of the Sectors are in overbought territory, we may see further weakness
going into October. Otherwise, we may see a return to the "risk-on" play…which
would be confirmed by renewed buying in the Nasdaq 100 and Russell 2000
Indices.

Each candle on
the charts below of the 4 Major Indices represents a Yearly 1/4. The
current candle closed on Friday and represents Q3. They all appear to have
formed a bullish engulfing candle; however, the only one that has a true one is
the Nasdaq 100 Index. The only Index that didn't close higher than the prior
candle's high is the Russell 2000. All indices have made a higher high for 2012.
The Russell 2000 Index is forming a triple-top with the highs of 2007 and 2011
and, thus, holds the biggest potential of a bearish pullback, or even,
a correction, from current levels…again, the one to watch for signs of major
weakness and rising volatility. Otherwise, Q3's candle action and close were
very bullish and signal a possible continuation of the uptrend. However, this
trend is aging and, along with it, the risk of a major pullback/correction
continues to grow.

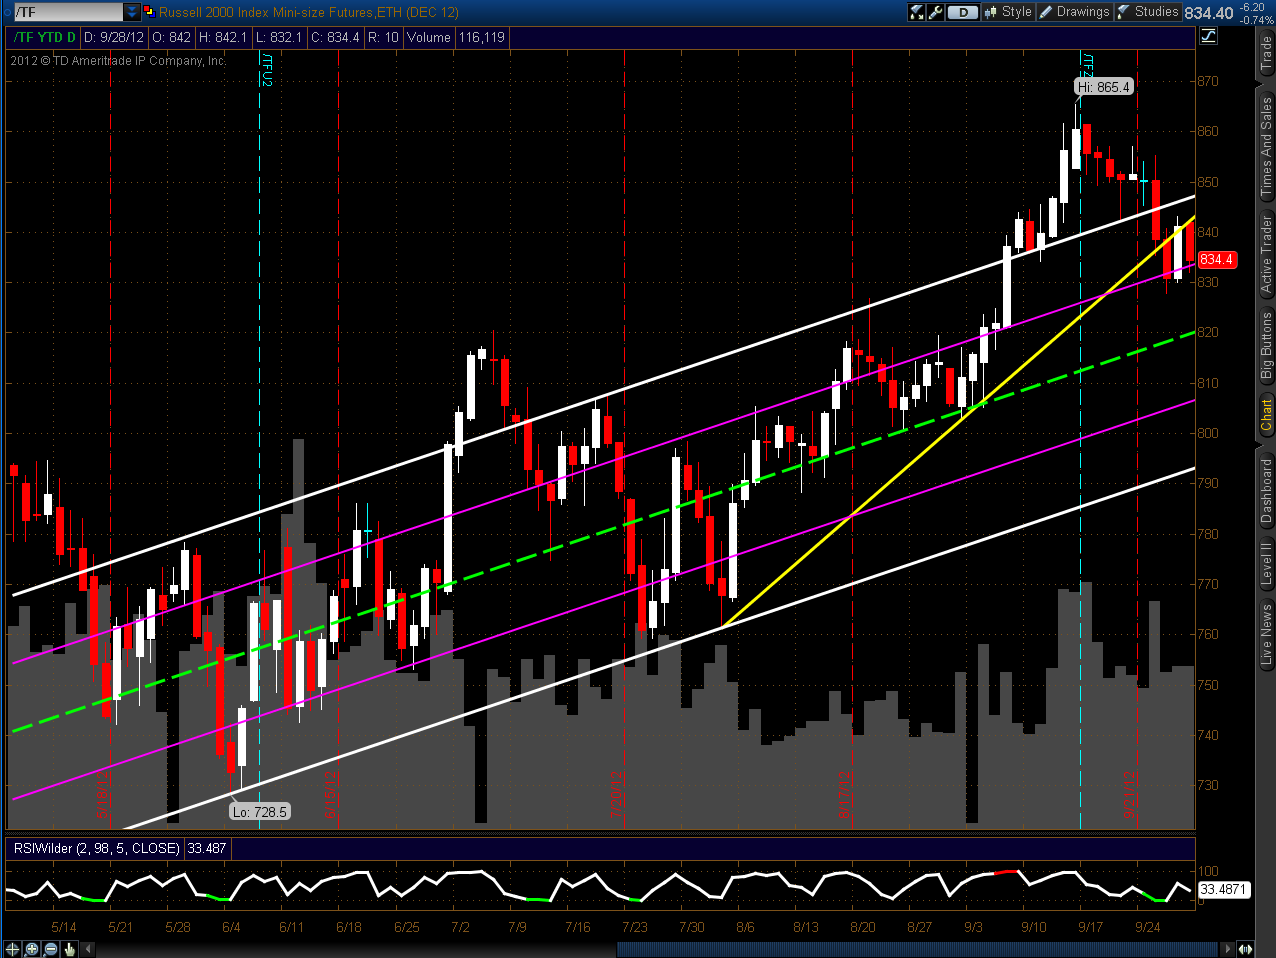
Drawn on each of the
Daily charts of the 4 E-mini Futures Indices
is a channel (which I think of as a "churn-nel" due to its
slow, choppy/whippy grind higher from the June lows of this year). I've also
included a more recent trendline (yellow) since price has been compressing
within this overall uptrend since July and hasn't reached the lower channel
since then.
Both the YM and ES are hugging the channel "mean," the NQ
has, once again, bounced off the upper level of its channel, and the TF is
trading back inside its channel. The only one that hasn't broken and closed
below its recent trendline is the YM…the one to watch is see if weakness
enters the Dow 30 stocks. Volumes are increasing on all of them, which is likely
signalling either a resumption of the uptrend, or a reversal. The channel "mean"
and recent trendline hold the key for direction for the YM & ES, and the top
of the channel holds the key for the NQ & TF. Inasmuch as my very short-term
RSI indicator is not yet in overbought territory (a reading of 98 is
overbought), we may see another day (or several) trade higher before we see a
reversal to, potentially, the lower channel.


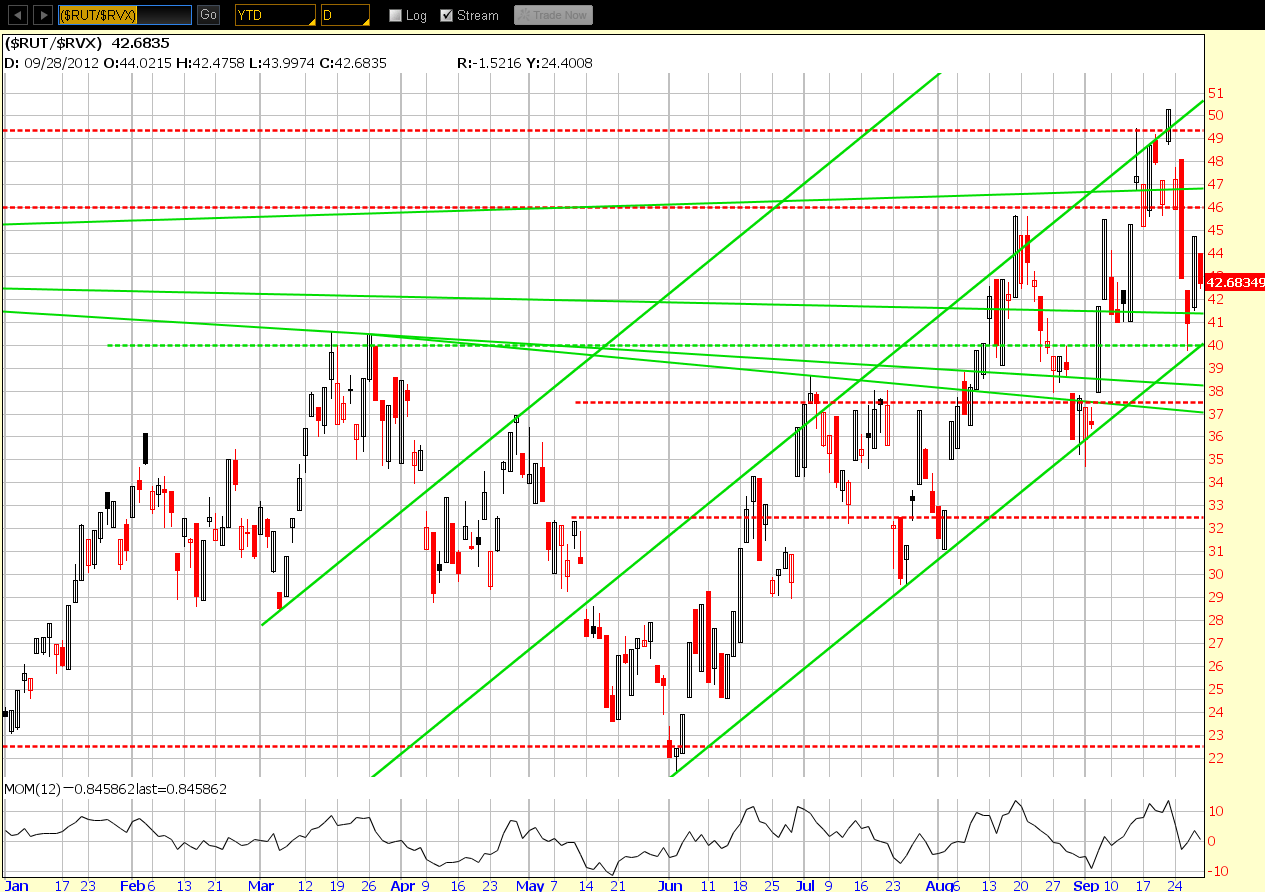
The two Daily
volatility ratio charts below represent price movement of the
S&P 500 and Russell 2000 Indices compared with
their respective Volatility Index. A move up means that volatility is
falling, and to what degree, and a move down means that volatility is rising,
and to what degree.
Price on both the SPX:VIX and
RUT:RVX ratio charts remains above the bottom of the lower
uptrending channel (green) and is stuck in a recent sideways range from August.
The Momentum indicator is back above the zero level, after dipping below two
days ago. I'm watching to see if price closes and holds below this channel and
if the MOM dips and holds below zero. This would signal that volatility is on
the increase and would confirm that the recent weakness that we've seen the past
couple of weeks is continuing, along with the potential for the 4 E-mini Futures
Indices to reach the lower part of the above-mentioned "churn-nel."

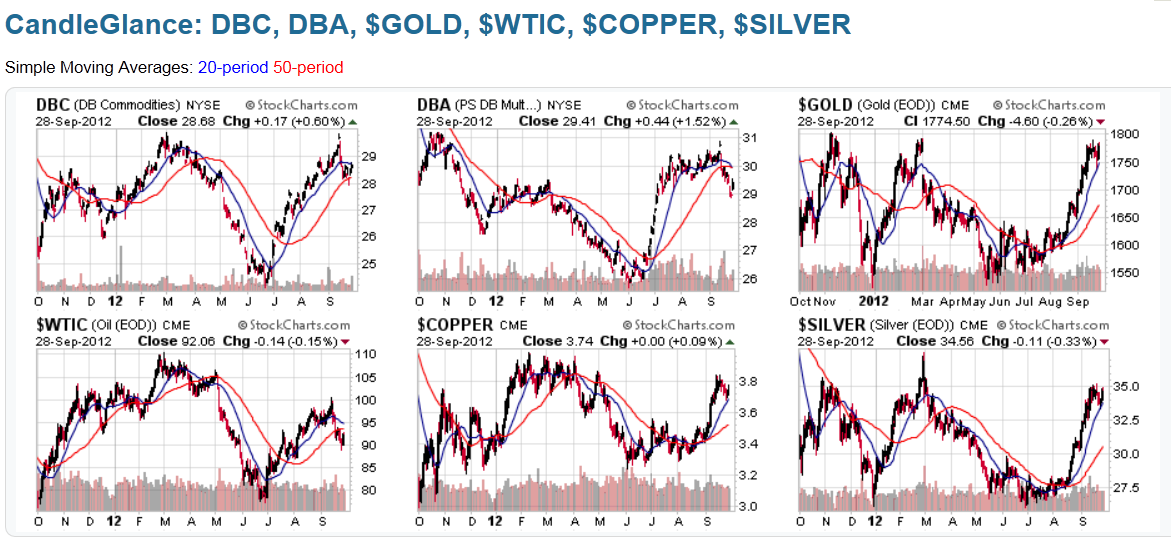
The Daily
charts and 1-Week graph below of the Commodity and Agriculture
ETFs (DBC and DBA), Gold, Oil, Copper, and Silver show
that prices are, generally, elevated on most of them. Agriculture and Oil have
seen a minor pullback over the past several weeks. DBA, Oil, and Copper
experienced losses this past week.

The Daily
charts and 1-Week graph below of the Major Currencies
show that, along with the "risk-off" trade, money flowed back into the U.S. $
(and, to a lesser extent, into the Yen) and out of the others. The U.S. $ looks
rather oversold at this point, whereas the others look overbought, in
particular, the Canadian $…a warning that we could see further weakness to
come in equities and commodities.


The
final chart is a Weekly of the 30-Year Bonds.
While there has been some profit-taking occurring since June, price has rallied
at a major support level, which, if broken, could signal that a major push is on
in equities, and, possibly, commodities. A meaningful flow of money out of the
U.S. $ would confirm this scenario.

In
conclusion, there are a variety of timeframes, as well as a couple of
Volatility Ratios, to be used as tools to, potentially, give us clues on the
strength/weakness of the Major Indices and the "risk-on" vs. "risk-off"
sentiment in the coming days/weeks. We also have the above Commodities,
Currencies, and Bonds to use as confirmations. It would seem that, generally,
the momentum still favours the upside, but the risk of a pullback/correction
grows the longer that continues, particularly if weak economic data
persists.
Several questions that one may ask that aren't related to
technical analysis, but which also hold the power to move/influence the
markets, are:
- Will the equity (and commodity) markets continue to shrug off weak data,
which is showing a slowdown in economic conditions (with declining GDPs), not
only in the U.S., but also much of the rest of the world, and push higher at
these current 5-Year highs? - Will these markets continue to push higher in support of the upcoming U.S.
elections in November and in the face of the enactment of the Fiscal Cliff
policies? - How much risk are the markets willing to take on from now until the end of
the year and at what cost? - How will markets react to Q3 earnings that are coming up in October?
- Which countries/regions are the wild-cards with respect to the first three
questions?…my guess is China, Europe, and the Middle East.
With
these questions in mind (and probably a lot more), I think that volatility will
definitely increase before the year is finished, and it could be sooner rather
than later. That's why I'll be watching the above technical tools for
clues.
Enjoy your weekend and good luck next week!
