Having lost new data a few days ago, stockcharts appears to been down altogether this morning. Hopefully this isn’t becoming a regular thing. I’ve managed to locate enough charts for the post this morning as I tend to post quite a few charts during the day, and I have picked three that I posted yesterday for this morning.
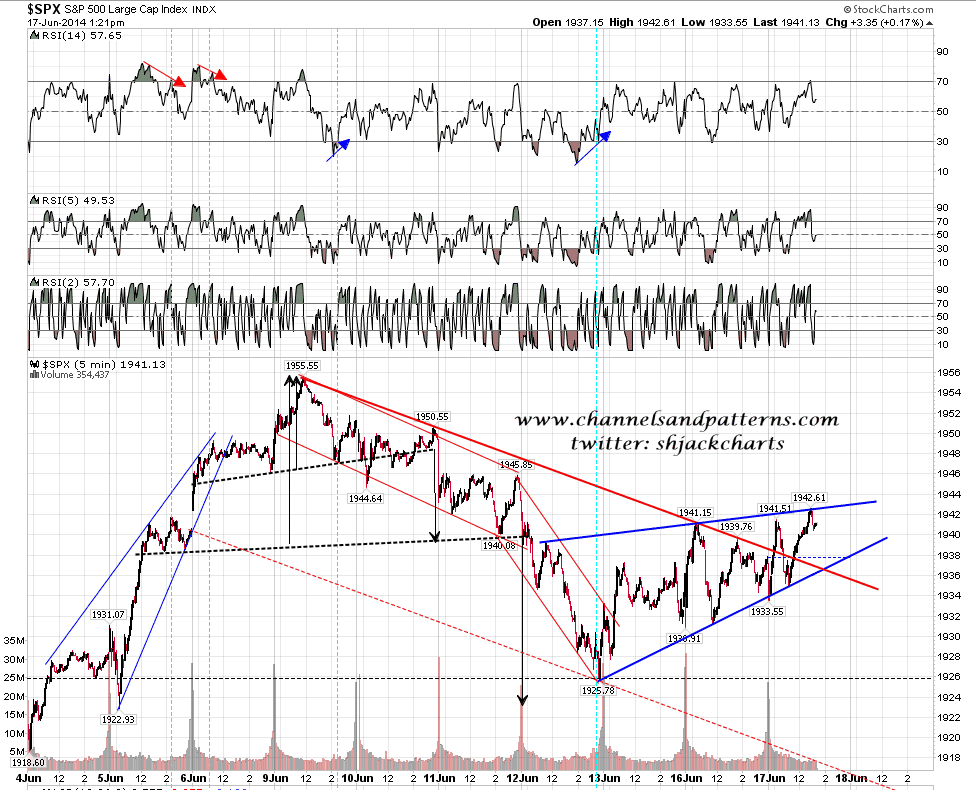
The first chart I posted on twitter yesterday afternoon, and it shows the rising wedge on the SPX 5min chart. This overthrew twice before the close and although this is a 70% bearish pattern targeting a retest of the lows on a break down, it may be that this one is going to take the 30% odds route and break up with a target in the 1960-5 area. SPX 5min chart (Tuesday PM):