
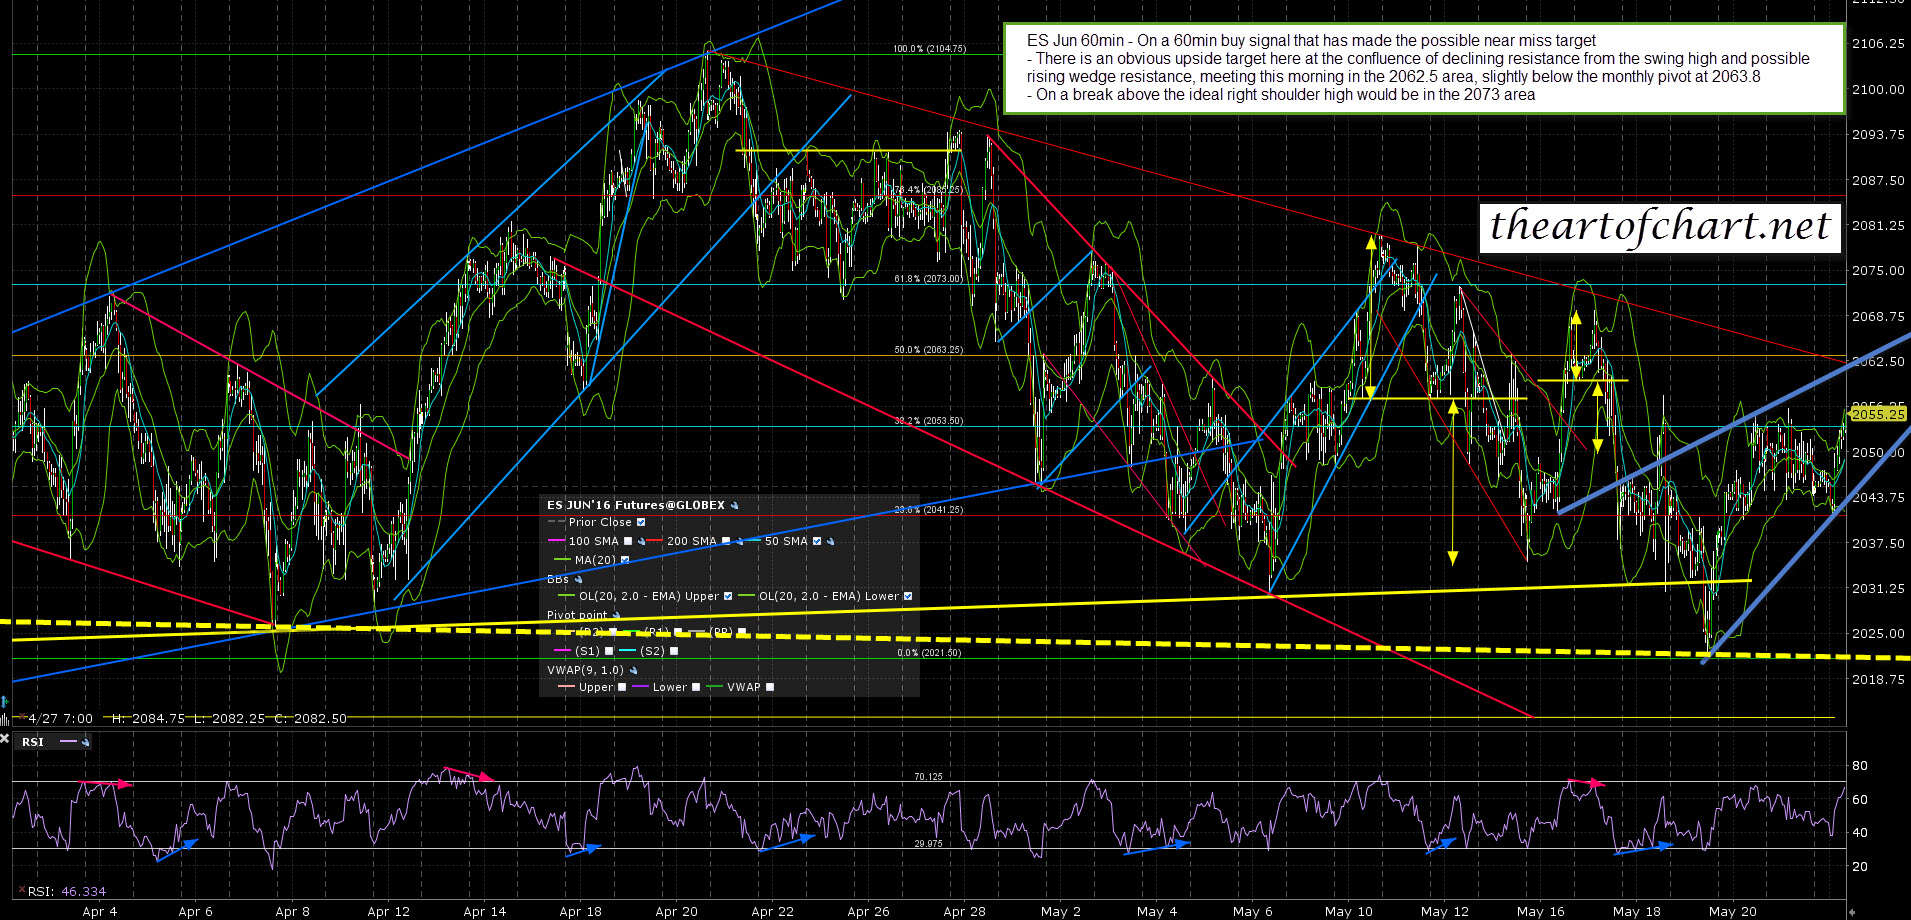
The bears had a chance to fail and continue down yesterday but couldn’t manage it, so we are running the bullish scenario that I was looking at yesterday morning. Since I posted the charts below at theartofchart.net this morning ES has gone through the declining resistance trendline in the 2062 area, and is trying to convert the monthly pivot at 2063.8 to support. If that succeeds the the ideal right shoulder high on the larger alternate H&S that I strongly suspect is forming on ES here would be in the 2072-5 area. ES Jun 60min chart:
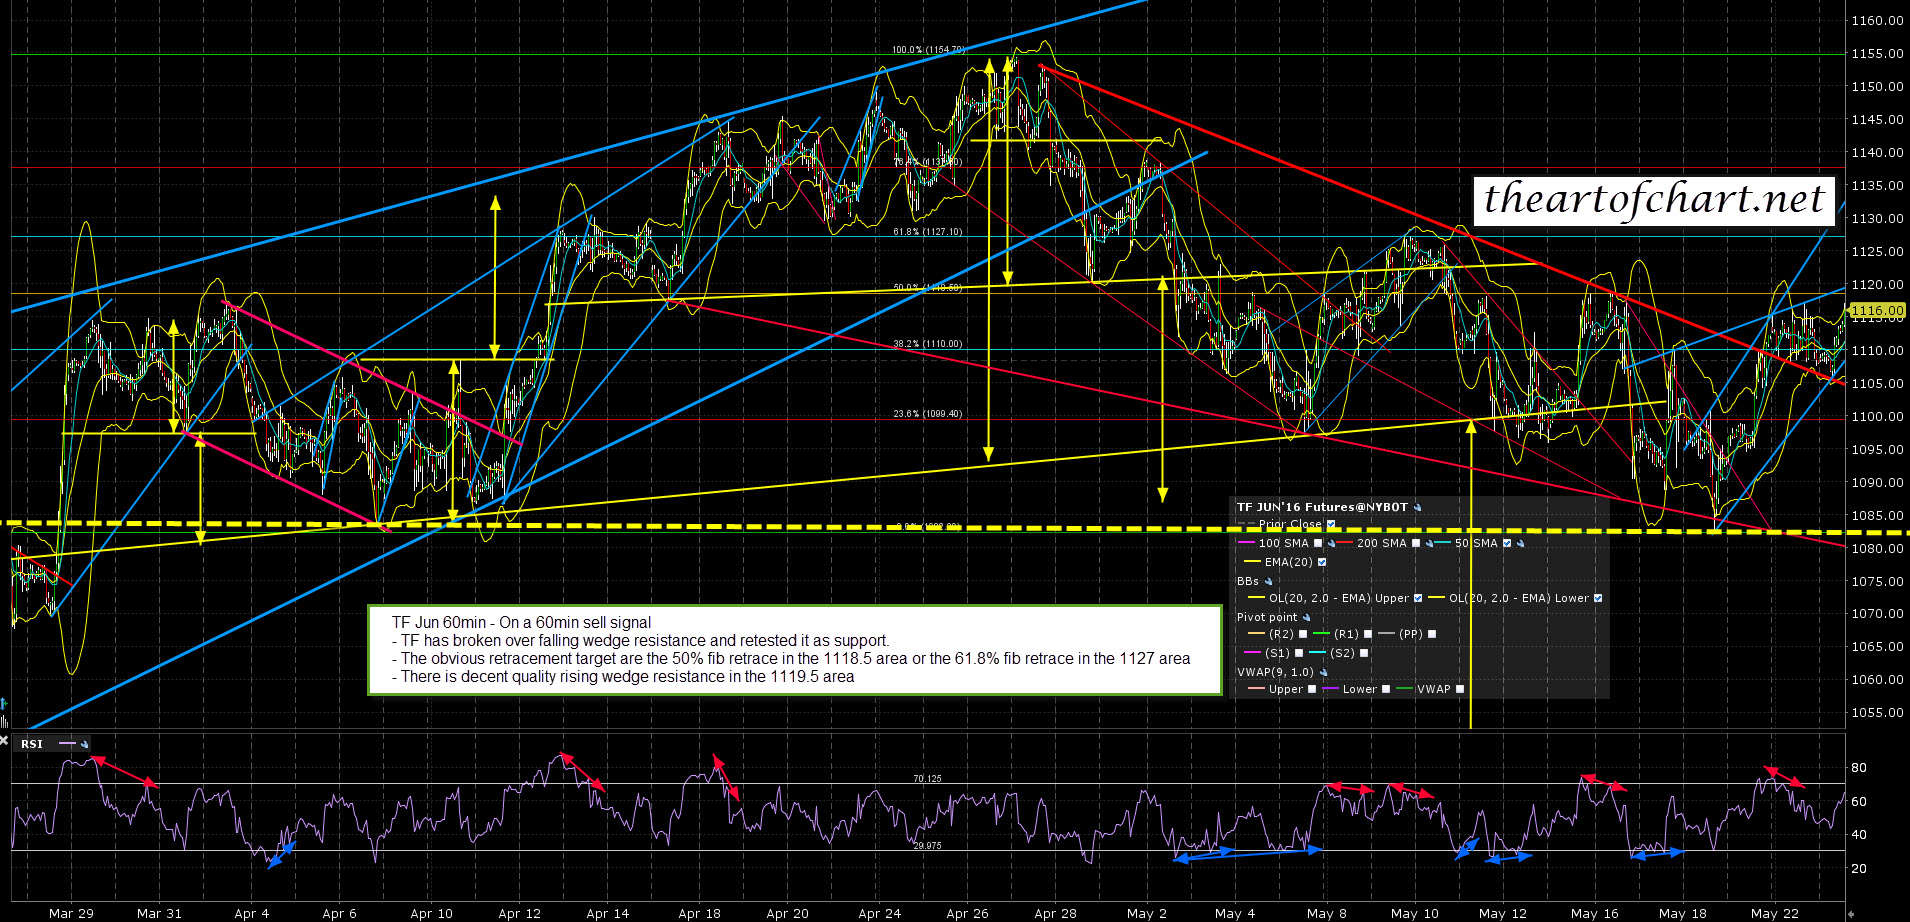
TF is now over the 50% fib retrace at 1118.50 and is testing the 61.8% fib retrace target at 1127. This is a strong resistance area and a sustained break above would open up a possible retest of the current swing high at 1155. TF Jun 60min chart:
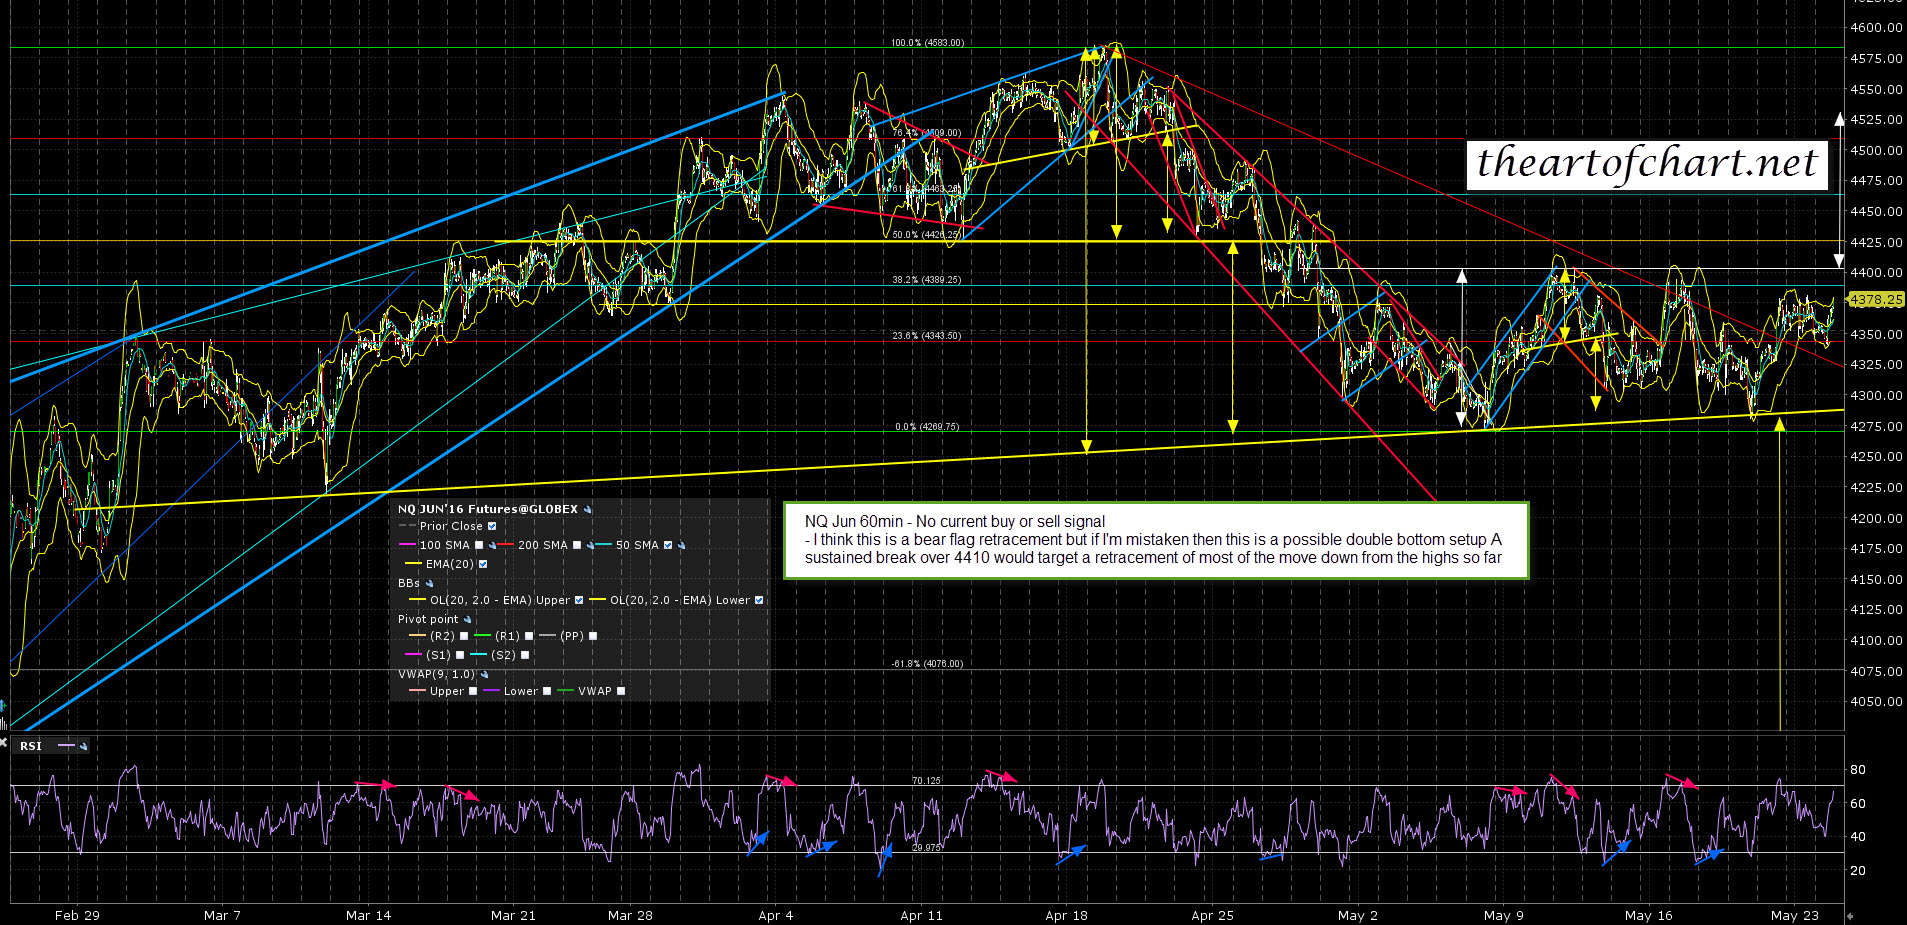
Is there a case for retesting the current swing highs? There doesn’t need to be really as that is a standard topping setup and these often happen unexpectedly. In this case though the nicest looking setup for this is on NQ and I was saying this morning on the chart below that a sustained break over 4410 on NQ would fix the double bottom target in the 4535 area. With NQ at 4421 as I write NQ is trying that out for size now. NQ Jun 60min chart:
If we see trend up today, and that is a very real possibility, then we could see the equity indices break some serious resistance levels. On SPX the key levels to watch are the daily mid band at 2062, which needs to be broken on a closing basis today, the 61.8% fib retracement at 2078, which needs to be respected if this isn’t a move to retest the current swing high, and 2090 which is where the daily upper band is now.
