
ES didn’t quite make it to the double pivot support yesterday, though the low at 2066 was arguably a test of monthly pivot support at 2062.5, and might be close enough. Obviously the SPX daily middle band held as support at the close and the intraday low was at a test of the 50dma. Can we see more downside?
Maybe, though the obvious next move on the SPX daily chart points to a retest of the 2108 high, and on a sustained break above 2108, to megaphone resistance in the high 2120s, and that may well be the target for this move up from yesterday’s low. In effect that would be a test of the all time high at 2134. SPX daily chart:

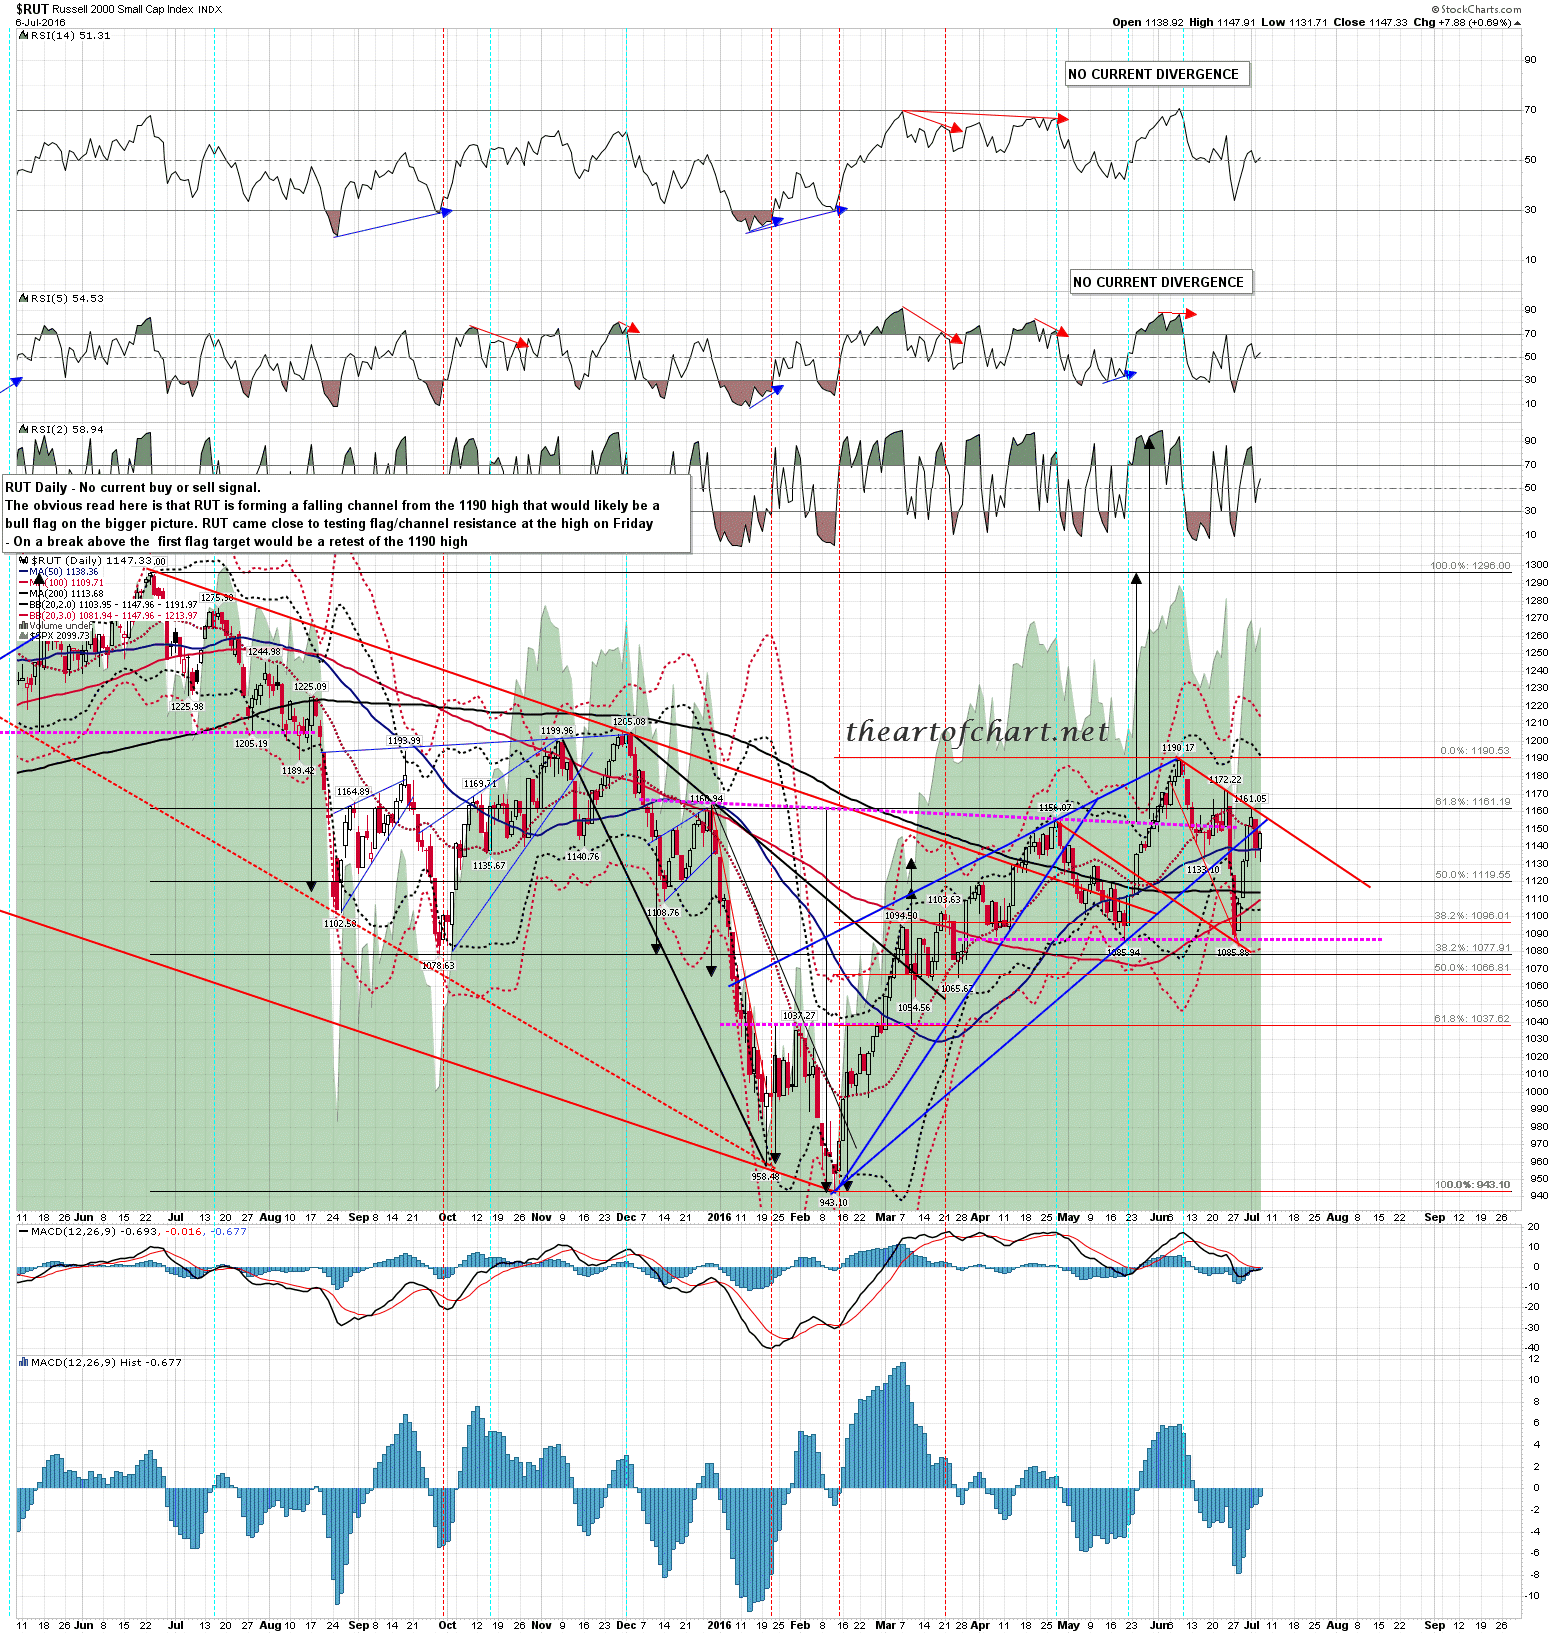
I mention regularly that the RUT chart is well worth watching, as it is a very technical chart, unlike NDX, which can often be a bit of a mess in trendline terms, and is at the moment. Not so with RUT, and the RUT daily chart is the best thing that bears have going for them here in terms of promising a strong retracement.
The move up from the February low on RUT was a clear rising wedge, and that has broken down into an equally clear falling channel, which would usually be a bull flag, and most likely is a bull flag here too. As and when the flag breaks up the flag should deliver a test of the 1190 high as the first target, and on a sustained break above the flag targets would be either a retest of 1296 for the second high of a double top, or the full flag target in the 1340 area.
Why is that good for bears? Well that’s because the flag has not yet broken up, and if we were to see a fast retrace back into flag channel support that would be in the right area for a 50% retracement of the move up from the February low in the 1066/7 area. That is a very natural target for any decent retracement here. RUT daily chart:
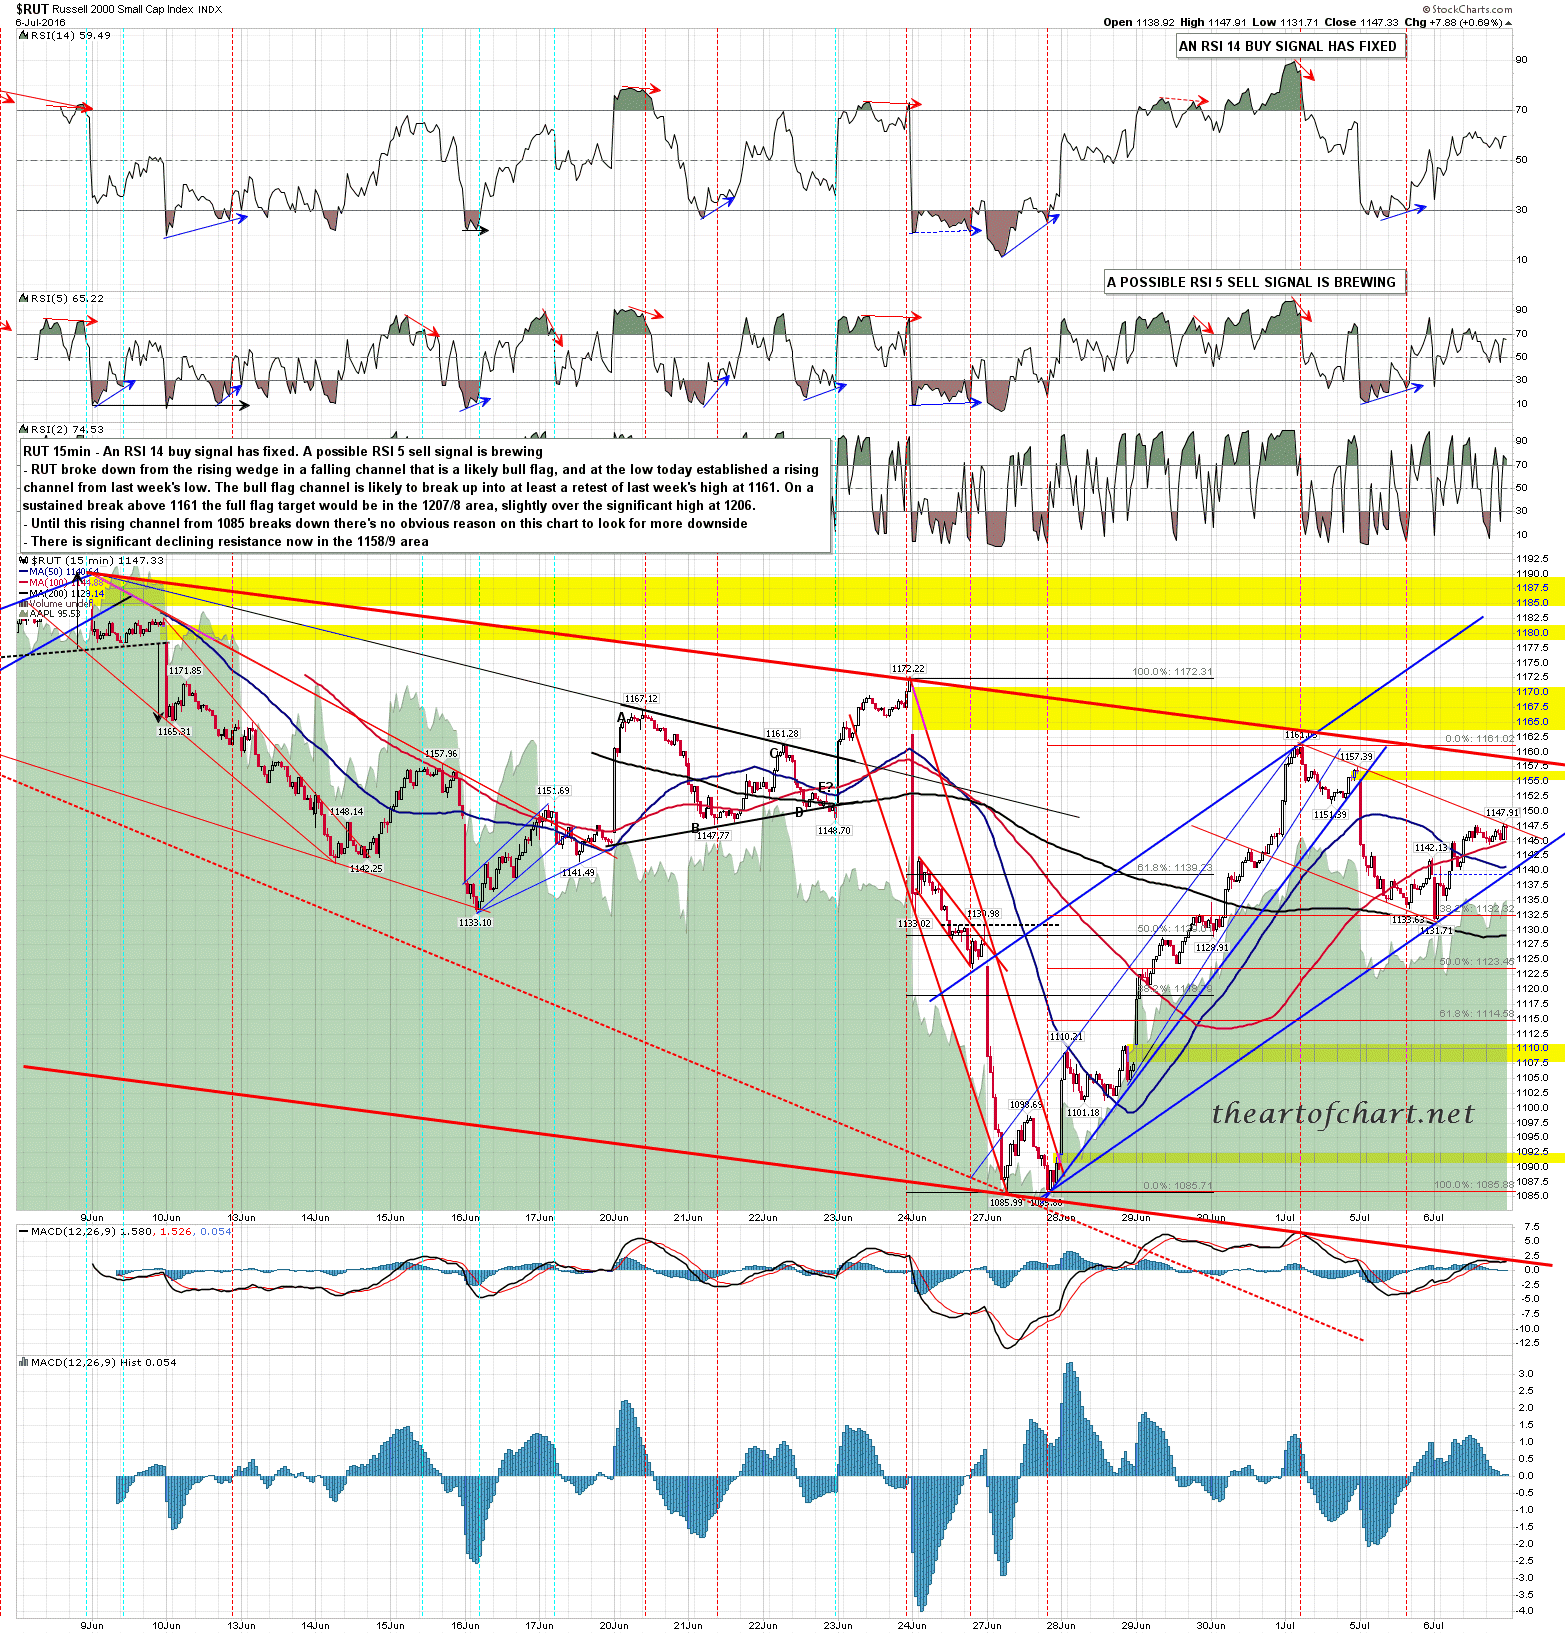
How’s that scenario looking on the shorter term RUT charts? Well on the 15min chart yesterday’s action does not look promising for bears at all. The low yesterday established a rising channel from last week’s low, so to break lower bears now need to break that rising channel to open up the downside.
The retracement this week has also formed a clear smaller falling channel, which as I mentioned looking at the bigger picture on the RUT daily chart, would generally be a bull flag in this context. RUT closed yesterday at bull flag/channel resistance and if that flag breaks up today the first flag target would be a retest of last week’s high at 1161.05. If that target was made, and normally it would be, that would mean that the larger bull flag channel would be breaking up with a target in the 1190 area, and that target would also normally be made.
This setup puts bears in the last chance saloon for more downside this week, with them wanting first to avoid a break over yesterday’s close at 1147.91, and if that breaks, with them very much needing to avoid a break of larger bull flag/channel resistance, currently in the 1158-60 area. If they fail to manage either then this move may well run into a new all time high on SPX in the next few days. RUT 15min chart:
Soooooo, the scenario I would prefer to see here depends on the bears not dropping the ball at this technically critical moment. Do they ever drop the ball at this kind of inflection point? Perhaps a better question would be whether they have ever recently not dropped the ball at this kind of critical inflection point? Bear performance at moments like this in recent years might charitably be described as mixed.
We’ll see what happens today, but bear chances would be considerably improved by an opening gap down that doesn’t fill. Today is a cycle trend day, with 70% odds that one side or the other will dominate the day, but the performance on these can be weak around holidays and we’ve certainly been seeing that lately. We’ll see whether that delivers today.
Just a reminder that you can buy annual memberships at theartofchart.net at 30% off this week only. On our daily video service there is a considerable expansion of the work Stan and I do here covering ES and SPX as well as detailed coverage every day as well of NDX/NQ, RUT/TF, DX, CL, GC & ZB, with less detailed coverage as well of NG and SB. You can get a better idea of what we do there if you watch the video on the Subscriptions page here.
