Slope of Hope Blog Posts

Slope initially began as a blog, so this is where most of the website’s content resides. Here we have tens of thousands of posts dating back over a decade. These are listed in reverse chronological order. Click on any category icon below to see posts tagged with that particular subject, or click on a word in the category cloud on the right side of the screen for more specific choices.

Wonderland

By -

Alice's_Adventures_Under_Ground_-_Lewis_Carroll_-_British_Library_Add_MS_46700_f45v“If I had a world of my own, everything would be nonsense. Nothing would be what it is, because everything would be what it isn’t. And contrary wise, what is, it wouldn’t be. And what it wouldn’t be, it would. You see?” –Alice in Wonderland

Silver out performs gold as both rise with Treasury bonds, which are in turn rising with stocks, as Junk bonds hit new recovery highs while USD remains firm as inflation expectations are out of the picture. This is highly atypical, maybe even unprecedented.

Some, deeply dug into their particular disciplines and biases, might say it is dysfunctional, as this backdrop simply does not make sense using conventional methods of analysis. Why again did I name this service Notes From the Rabbit Hole?

(more…)

The Truth Behind the B(L)S Report

By -

Contributed by Rohit Goel (rgoel441@gmail.com)

The June 2016 Jobs report was so strong that it pushed US equity indices to their lifetime highs. But was it really that strong? Being the natural sceptic that I am, I decided to investigate. Of late, I have been paying attention to the breakdown of employment numbers by age.

Comparing the June 2016 data with the May 2016 data (http://www.bls.gov/news.release/pdf/empsit.pdf, Table A-9) immediately confirmed my suspicion – the critical categories of 20 to 54 years had cumulative job losses of 39k, and the only driver of the report’s strength was job gains of 259k in the 55 years and over category. Intuitively, the jobs created in the latter category are mostly lower-quality jobs – but more on this later.

(more…)

Testing Major Resistance

By -

Apologies for the late post today. Busy morning.

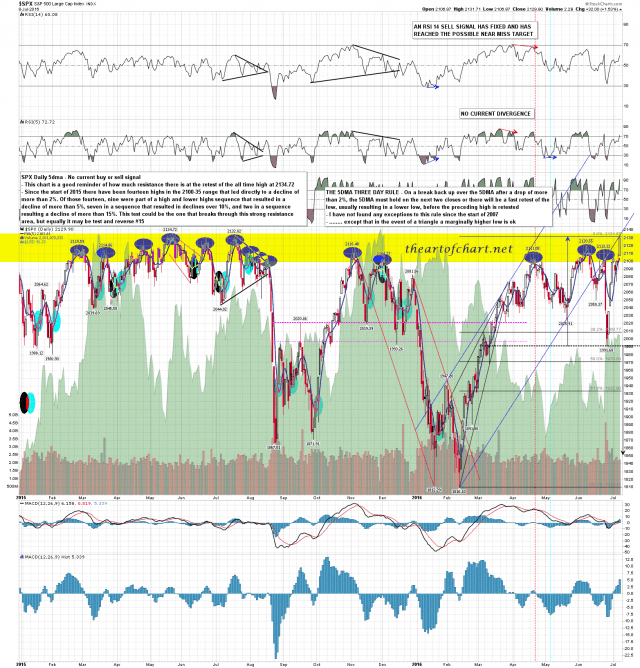
I did the chart below over the weekend for chart service subscribers at theartofchart.net, and it shows the many attempts on SPX to break through resistance in the 2100-35 area. Since the start of 2015 there have been an impressive fourteen highs in this range that have led to short term reversals of over 2.0%, and this morning of course SPX has broken above slightly to make a new all time high at 2141.

This area has a number of big resistance levels. 2138 is a major fibonacci level, the weekly upper band is at 2139, the daily upper band is at 2144. SPX has not broken through these with any confidence yet. SPX daily 5dma chart:

160708C SPX Daily 5dma

(more…)

Ten Trillion Yen

By -

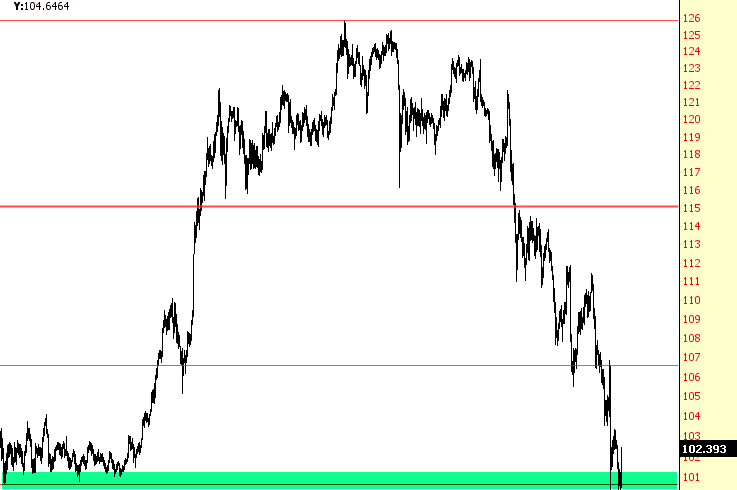
I happened to notice lots of poking fun at poor old Fibonacci studies this weekend, but I’ll say this: for months now, I’ve had a target of approximately 100 for the USD/JPY based on nothing more than a simple retracement study. It nailed that target (almost to the pip) last week, and it’s roaring 1.75% higher this morning, thanks to chatter about yet more stimulus from Japan (ten trillion yen this time……….like, umm, that’s going to help.)

0710-yen

(more…)