Slope of Hope Blog Posts

Slope initially began as a blog, so this is where most of the website’s content resides. Here we have tens of thousands of posts dating back over a decade. These are listed in reverse chronological order. Click on any category icon below to see posts tagged with that particular subject, or click on a word in the category cloud on the right side of the screen for more specific choices.

Candlestick Commentary

By -

It certainly was nice to get a down day for a change. I wanted to share three charts and a remark about each one. These are all short-term candlestick charts.

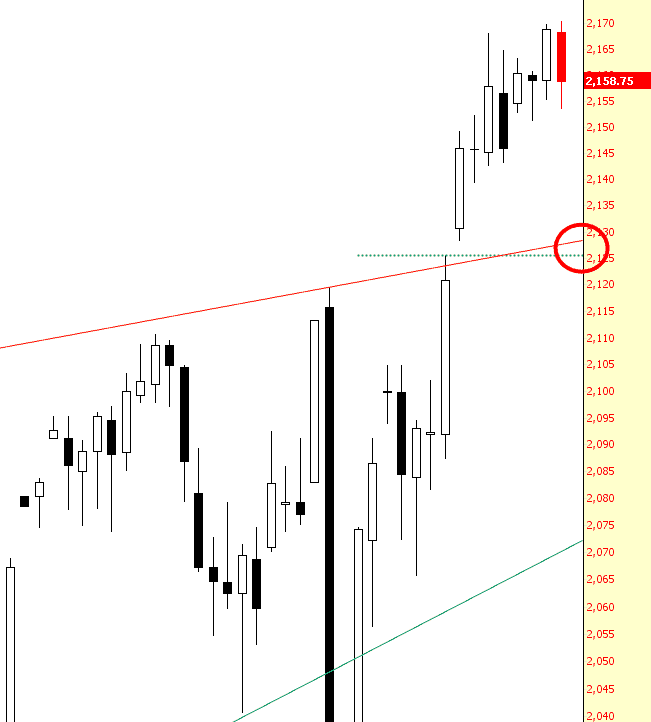
The first is the ES, which has been in a bullish uptrend since the (now laughable) Brexit event. Until and less it breaks beneath the level I’ve marked below, which is both the upper trendline of the pattern as well as the post-jobs report gap, the uptrend is intact. 2125 needs to be busted before the bears can really breathe any sigh of relief.

0721-eds

(more…)

Gold vs. Commodities

By -

The signals of gold vs. other assets and markets have become so important to financial markets over the last year (hello Macrocosm, July 27 2015) that I have created a standard segment in NFTRH called ‘Gold vs.‘.  The segment regularly checks up on gold vs. stock markets, currencies, bonds and of course, commodities.

Here is the state of the latter.  After the chart I’ll summarize some of the market signals.

au.crb

  • Au-CRB is in a long-term uptrend.  This uptrend has been in place since late 2014, when not coincidentally, volatile market disturbances started to erupt.  The uptrend is in place, indicating a generally counter cyclical global atmosphere.  If gold breaks down vs. cyclical CRB the ‘inflation’ play would drive hot money out to other areas beyond gold mining.  If not, the favored gold mining fundamental backdrop will have held up.

(more…)

Follow The Yellow Brick Road

By -

I never managed to get a post out yesterday in the end as I was preparing for my vacation so I’m doing an early post today before I go using charts I did last night for Basic Chart Service subscribers at theartofchart.net.

SPX inched a little higher yesterday and a possible strong RSI5_NYMO daily sell signal is now brewing. SPX may go a little higher but not much I suspect, and I am expecting that sell signal to fix within a couple of days. After it does I’m expecting a retracement to at minimum test the daily middle band, which closed yesterday at 2111, and likely lower. SPX daily chart:

160720C SPX Daily

(more…)