Slope of Hope Blog Posts

Slope initially began as a blog, so this is where most of the website’s content resides. Here we have tens of thousands of posts dating back over a decade. These are listed in reverse chronological order. Click on any category icon below to see posts tagged with that particular subject, or click on a word in the category cloud on the right side of the screen for more specific choices.

Prelude to a Crash?

By -

Pardon the sensational post title, but an email from a subscriber (‘L’, a financial advisor) had a grounding effect on me. He sent me this photo along with…

“I thought you might be interested in the breadth thrust that is going to trigger today. For some reason the Internet seems to be full of misinterpretation of a thrust. My numbers show that this will trigger today. Sets up for a 1987 scenario it seems to me. Attached is the history of it.”

breadththrust

(more…)

Armed Forces

By -

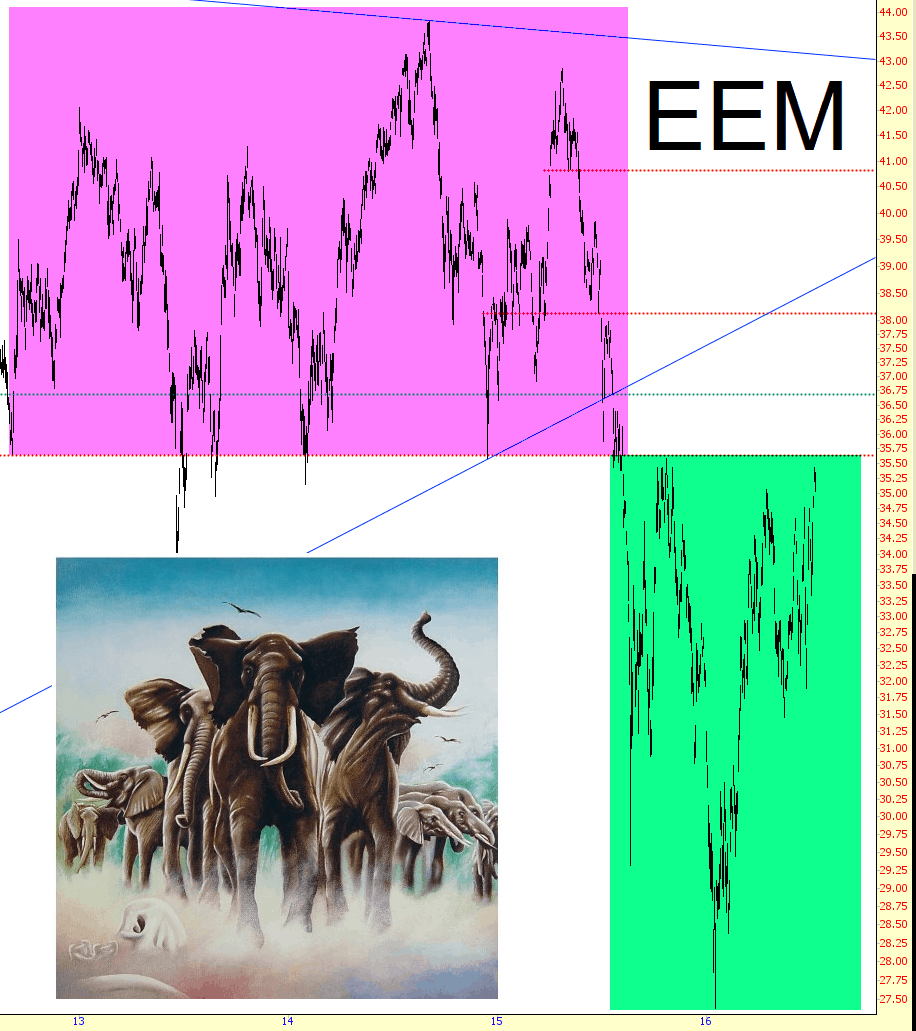
Just a simple chart to share: the emerging markets ETF, shown below, has what I consider to be an important line at $35.64 – – – that’s a mass of overhead supply (tinted in magenta) versus an inverted head and shoulders pattern (tinted in green). Thus, the battle line has been drawn. If we slip clearly above it, that could help power global markets (and really accelerate the S&P 500 to heights never seen before). On the other hand, if we encounter exhaustion at this point, all that overhead supply is going to act like a lead wall to further gains.

0713-eem

SPX Daily Upper Band Ride Day 3?

By -

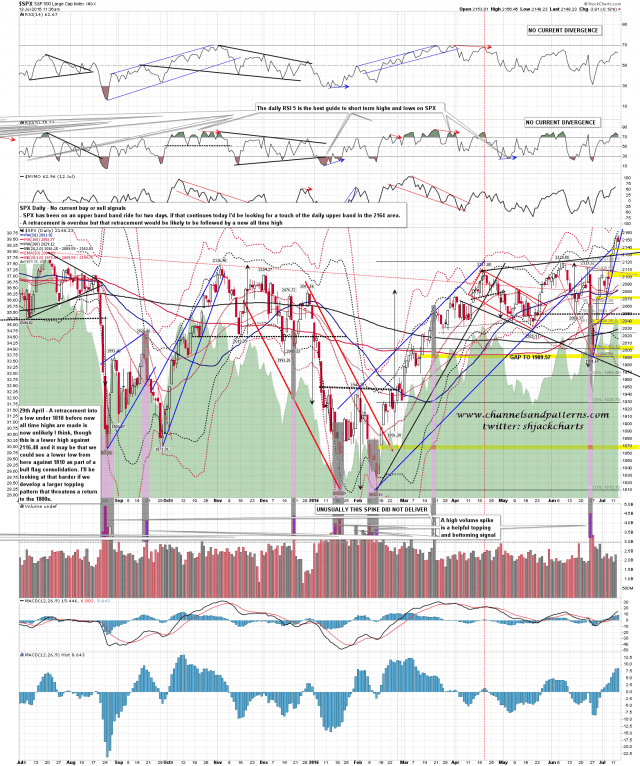
SPX has had an amazing run the last few days and I understand that this move up from the 1991 low is the strongest thrust up in over 5 years. A move like this is akin to an extended trend day, in that there is no shortage of counter-trend setups, but these all tend to fail until the move is nearing the end. We’ve had some weakness this morning, and an impressive range of 60min sell signals have fixed across the indices, but there is a much higher than usual risk that these won’t deliver a decent retracement. On the bigger picture this move is very likely to need higher, and any retracement here is likely to be a dip to buy.

If SPX manages to push up through the negative price action this morning then SPX has been on a daily upper band ride for the last two days, and if that is to continue today, then I’d expect a touch of the daily upper band at 2164 before the close to maintain the band ride. SPX daily chart:

160713 SPX Daily Band Ride

(more…)

Next Floor Down

By -

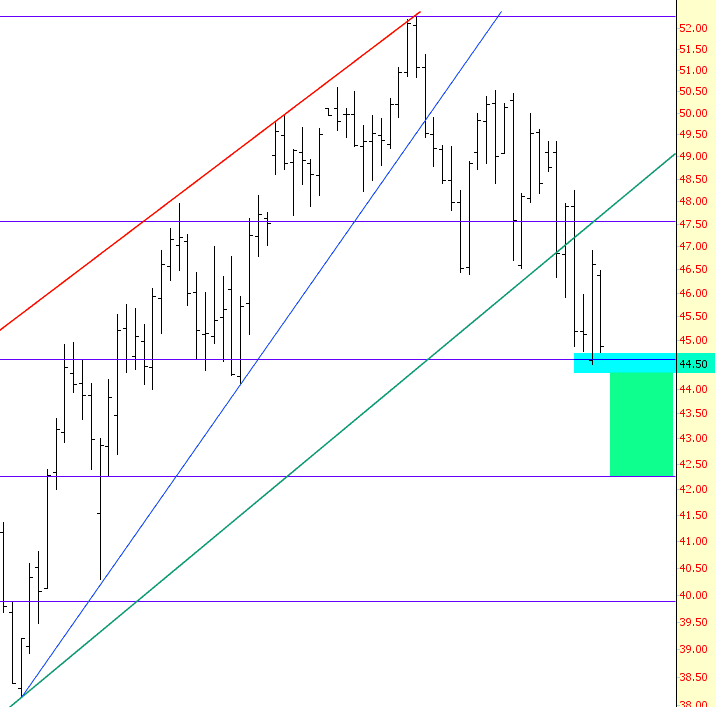
So even though charts are totally without merit, technical analysis is a hare-brained fantasy, and Fibonaccis are a joke (at least according to the upstanding citizens who swing by Slope for time to time for no other purpose to pee on my raison d’etre) , I wanted to follow up on my post from last night. Because of a loving, merciful God, crude is, in fact, falling to pieces, down about 4.2% as I am typing these words, completely in line with what Fibonacci (and my trendline, shown in green) predicted:

0713-crude

The blue tint is the Fib level, and it must be broken for the next phase to begin. If it does, we can look forward to the green tint as the drop zone, with about $42.25 as our next target.

Of course, that’s only if you believe this nonsense.

Positive Paternity Test

By -

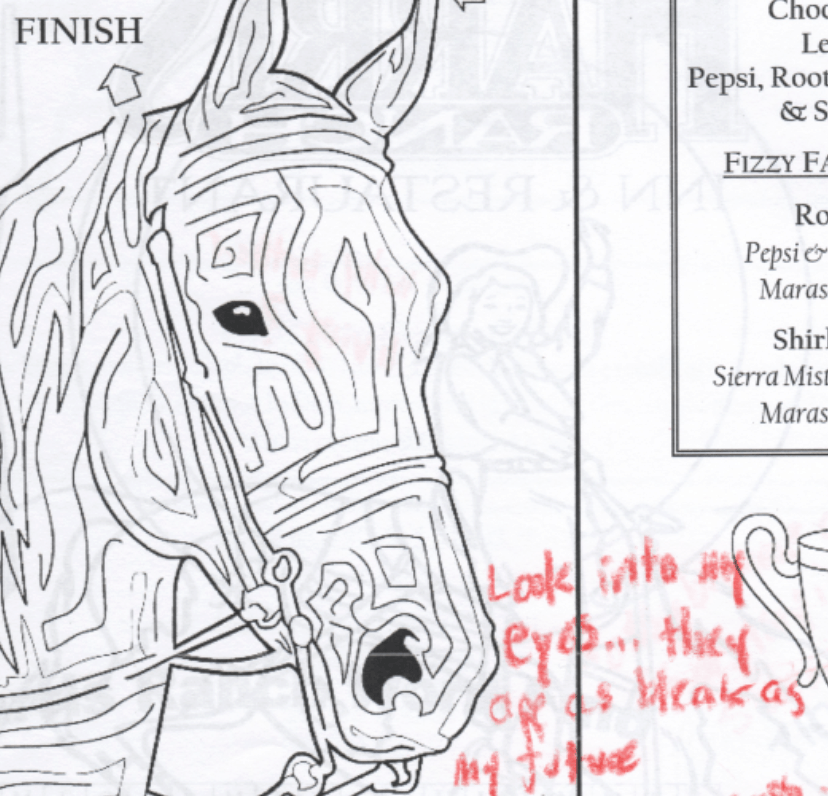
I was thumbing through some old files, and I happened to find this tidbit I saved from years ago. It’s one of those puzzle pages that children’s menus have at restaurants, and one of my offspring embellished it……..

0713-horse

If you can’t quite read it, it says, “Look into my eyes……..they are as bleak as my future.” No need for a DNA test, folks. This is definitely a Tim Knight family member.