NQ/NDX and RUT/TF have now both reached their respective IHS necklines and broken slightly over them, so the possible Janus bear flag setups on both are set up and ready to fail into the retests of the previous lows. ES/SPX is the only laggard, but of course there was already a strong target at the last low there. In the video below I’m saying that ES/SPX may have topped out on this move yesterday. We’ll see.
I was asked a couple of questions about a fuller explanation of Janus flags yesterday and they are a pattern of mine so they aren’t written up formally anywhere yet. I tweeted a good recent example on CL and more explanation on my twitter this morning, so you can see that there if you want. Intraday Video from theartofchart.net – Update on ES, NQ and TF:
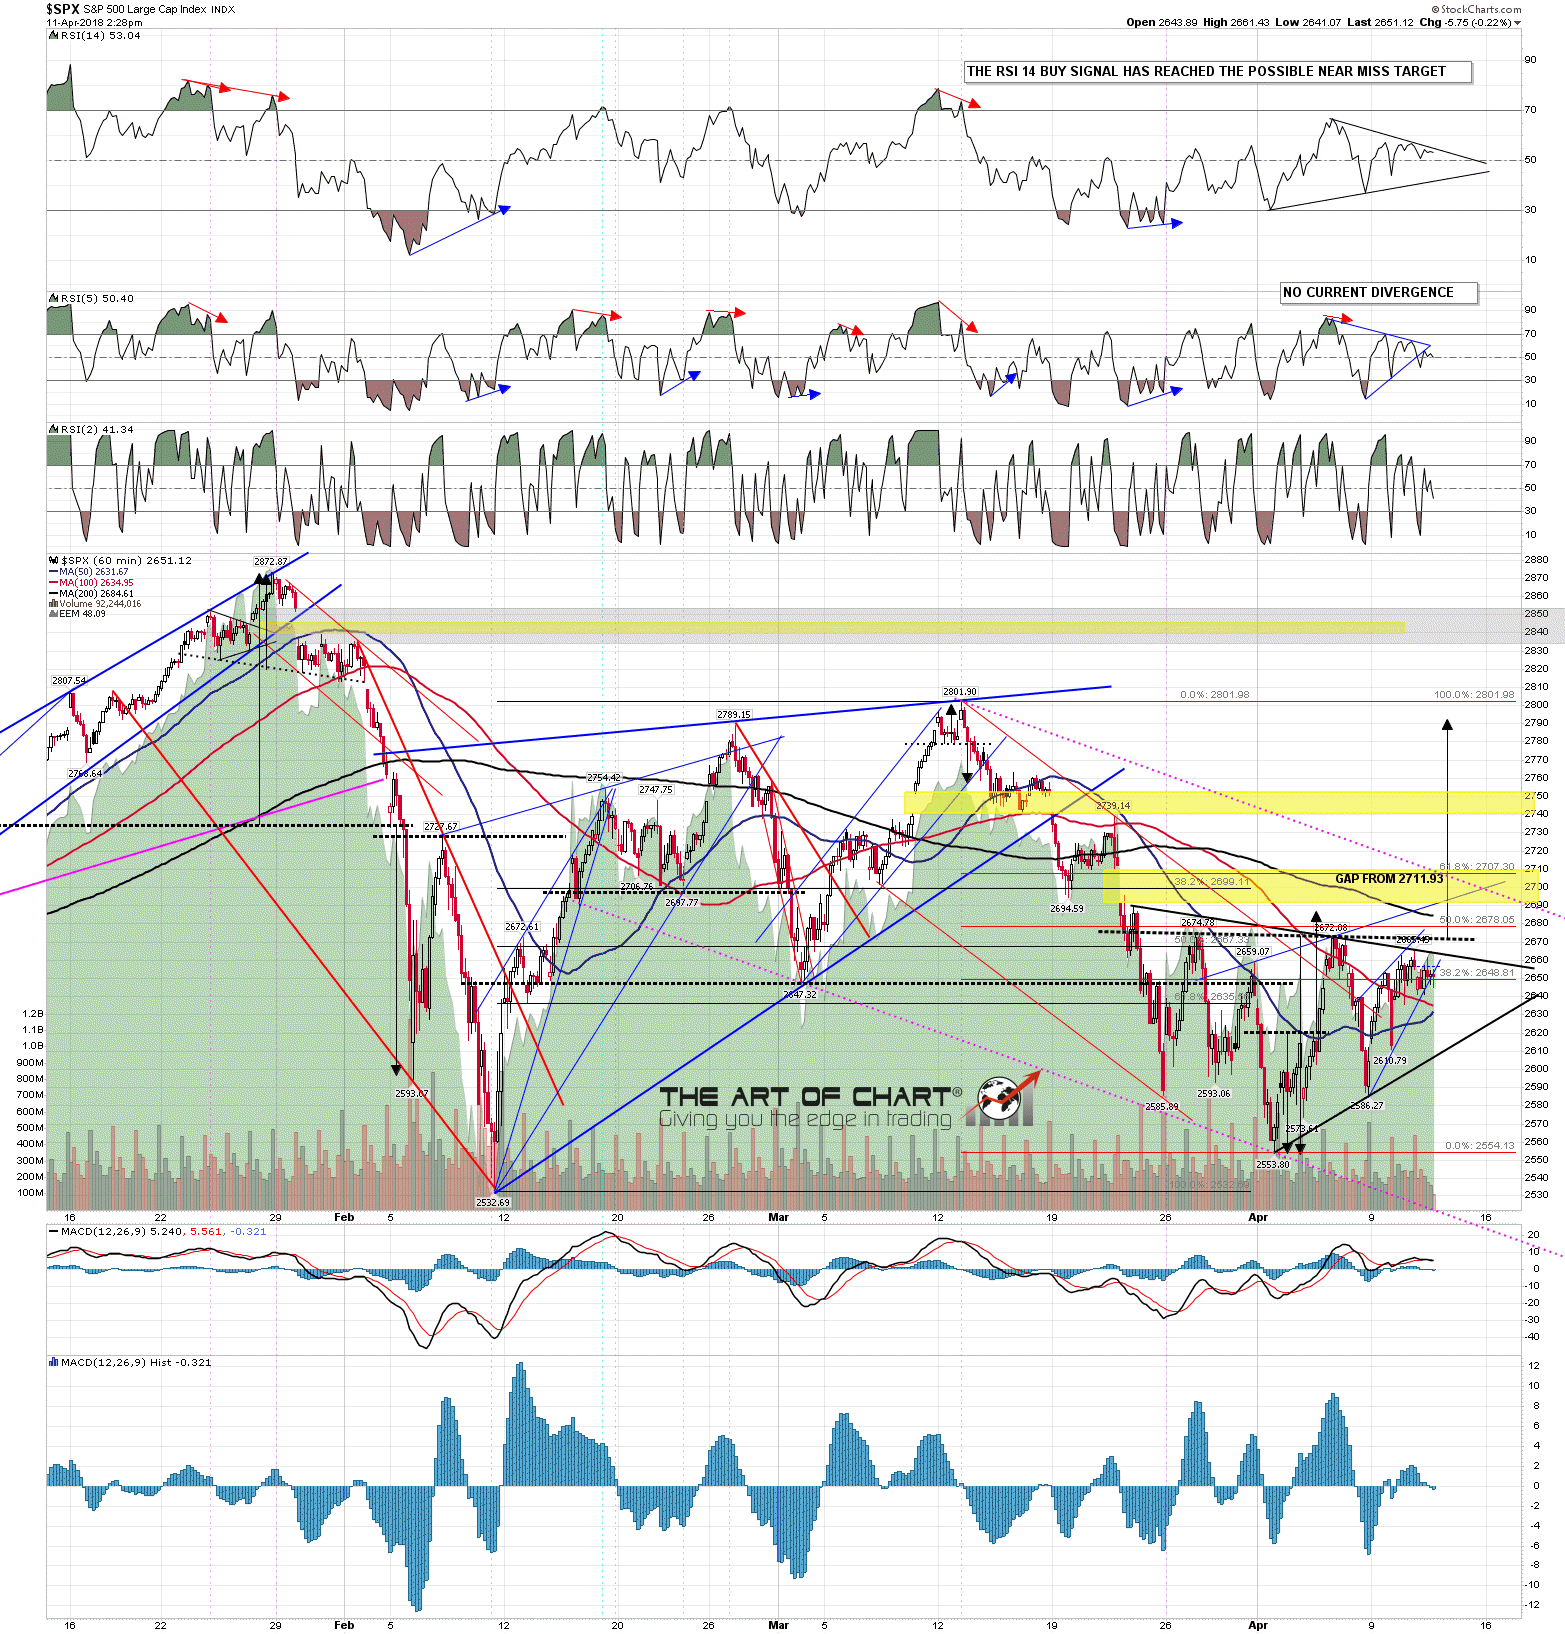
So what is happening on SPX here if this high was made yesterday? Well Stan has been running this as a likely triangle forming and the high yesterday was at a high quality triangle resistance trendline. If so, then SPX is likely topping out here for a return to triangle support, now in the 2610 area.
One way or the other SPX has been compressing for a while here and pressure is building for a strong move out of this compression. My Three Day Rule target says the expansion will very likely be downwards, but while that stat has never failed since the start of 2007 over dozens of instances, that just means that it hasn’t failed yet, as there is no such thing as a definite outcome on any setup or statistic. Fill the open breakaway gap from 2711.93 on SPX and that expansion could still be upwards. SPX 60min chart: