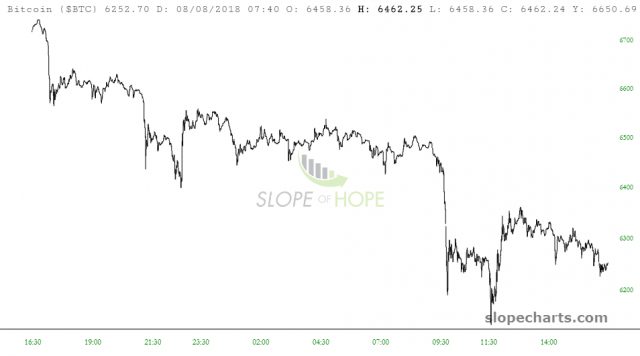
Did someone accidentally shove yesterday’s tape in? This is getting silly. Here’s yesterday’s end-of-day action………..
Slope of Hope Blog Posts
Slope initially began as a blog, so this is where most of the website’s content resides. Here we have tens of thousands of posts dating back over a decade. These are listed in reverse chronological order. Click on any category icon below to see posts tagged with that particular subject, or click on a word in the category cloud on the right side of the screen for more specific choices.
Bull Flag Compression
ES has been compressing for a couple of days now, forming a likely bull flag for the next leg higher. That may have made a low overnight or may have a bit lower to go before the next leg up begins. A break and conversion to support of the current short term high at 2863.75 ES should clear the path to the all time high retest. Partial Premarket Video from theartofchart.net – Update on ES, NQ:
A Very Serious OXY-Dent
I have a variety of short positions in the energy sector, and one of them today is doing particularly well: Occidental Petroleum, which gapped down below its range.
Obedience is Elegance
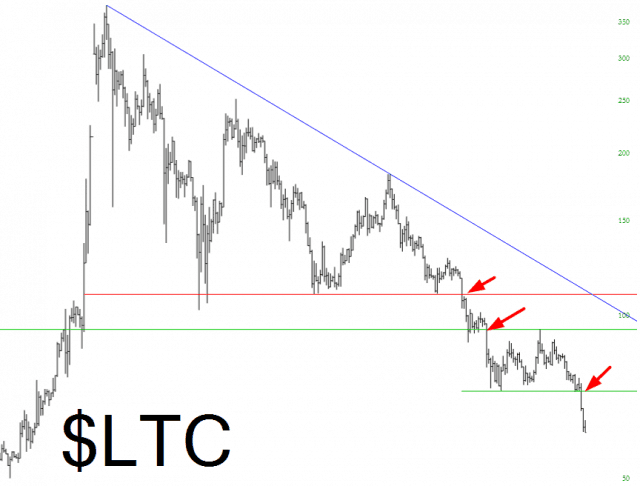
At the risk of making it seem like Slope has become a crypto-haven (it hasn’t…….) I must say once again how remarkably well-behaved the crypto crap is when it comes to technical analysis. This is how it’s supposed to work, expressed as a chart, when central bankers are falling all over themselves to prop things up. Good old classic human psychology at work.
Here, for instance, is LiteCoin. Notice how each key support level, once it gives way, leads to fresh weakness.
Intraday Crypto
As you have hopefully surmised, we are piling on more and more data sets and feature types into SlopeCharts. The latest is intraday data for crypto-currencies.
You use it just like anything else: enter the symbol (like $BTC for Bitcoin) and choose the granularity you want from the dropdown (such as “1” for 1 minute bars). Here are some examples I just pulled:


