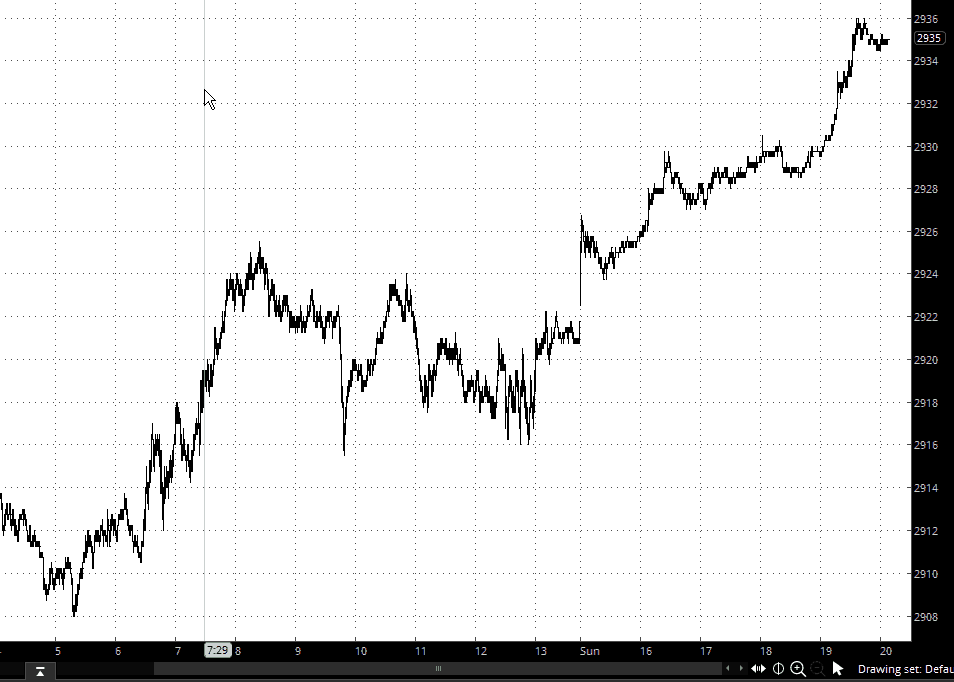
As I sit here on Sunday night, enjoying my pizza from Delfina Pizzeria, I’m waching the screen turn green, to the delight of equity bulls, now that NAFTA is going to survive. Only recently did it seem Canada was going to get left out in the proverbial cold, but the three countries of North America are all buddies again, and the ES is ripping higher.
Slope of Hope Blog Posts
Slope initially began as a blog, so this is where most of the website’s content resides. Here we have tens of thousands of posts dating back over a decade. These are listed in reverse chronological order. Click on any category icon below to see posts tagged with that particular subject, or click on a word in the category cloud on the right side of the screen for more specific choices.
Young Traders, Unite!
For years, the fellows on ZeroHedge – – and, on occasion, here on SlopeOfHope.com – – have teased fabled commentator Dennis Gartman for his financial picks. It seems that he is driven in no small part by whatever is hot or cold at a given time. In other words, seat-of-the-pants emotions seem to be an important element in the ideas offered.
However, I’ve stumbled upon someone who seems to completely out-Gartman Gartman, and although I know very little about the man himself, he has a huge YouTube following. His channel on YouTube is called “Financial Education”.
I stumbled across this fellow for the first time because of some videos he posted about Tesla. Over the course of just 48 hours, he released at least five lengthy videos about why Tesla was an amazing stock to buy or, alternately, why it must be dumped immediately. As you can tell from the change of facial expressions below, he went from ecstatically proclaiming that Tesla was heading to $3,000 per share (September 27th, at the bottom) to a declaration that I’m So Done (September 29th, the top). (more…)
Long-Awaited Break……Or Is It? (by Moneymiser21)
The alternative rock band Green Day once sang “Wake me up when September ends.” Now that September trading is over, let’s see where THE most important chart in the world stands.

Q3 2018 Ends On A High Note For U.S. Equities
Each candle on the following three charts of the S&P 500 Index represents:
- a period of one month (Chart #1)
- a period of one quarter (Chart #2)
- a period of one year (Chart #3)
Each of the last candles on all three time frames closed higher than its prior time-period candle.
The most notable feature of the Yearly chart, in particular, is that price could, in fact, reach a resistance target of 3033 (as I described in my post of August 6th) by the end of this year. Such a price level would end up producing a candle range for 2018 on the Yearly timeframe that equals or slightly exceeds the candle range of each of the prior two years. It would also complete a very bullish cycle for this year.
On My Radar
Here are nine new short-sale ideas. For my premium members, here are an additional twelve.