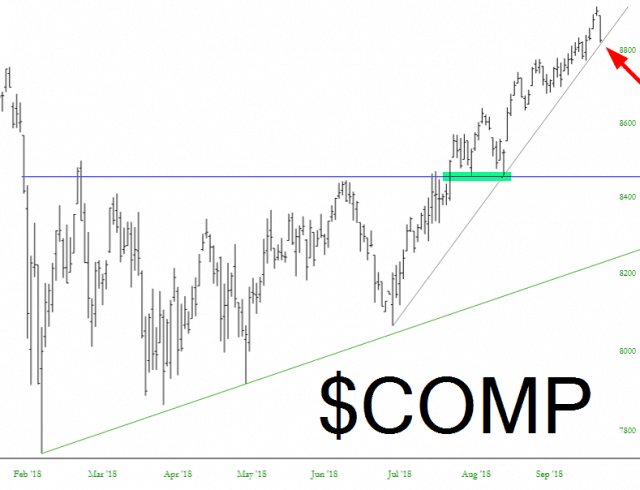
Today (as I’m typing this, Monday) was quite a good day for me. I’ve been bullish on interest rates all year (and my Premium members in particular know of my obsession with the Most Important Chart in the World ™ ) and that’s moving As God Intended. One down day isn’t going to solve our problems, of course, but I’ve got to say, if Tuesday is a decent down day, there’s going to be some interesting damage happening. Take a look at the broad Dow Composite, for example:
Breaking a trendline that is measured in weeks isn’t that big a deal, however. Referring to the same chart above, we’d really need to break the horizontal, where I’ve drawn the green tint, in order to truly change the trend.
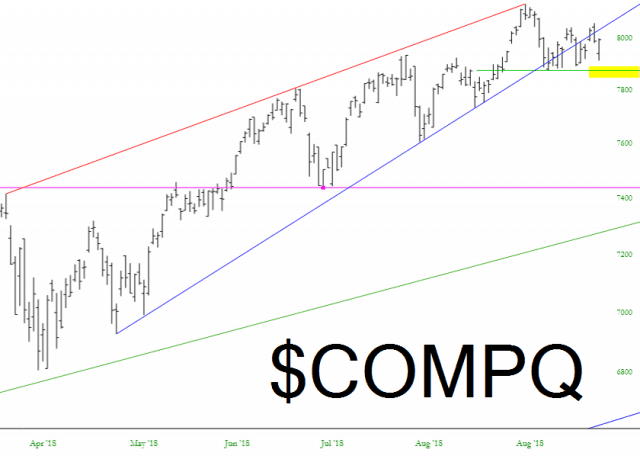
The NASDAQ is more vulnerable, however. I’m already short AMZN, and frankly if Facebook craps the bed when it reports Q3, that could mark a serious sea change in investor psychology with respect to tech. We’re already broken the intermediate trendline, and a failure of the yellow tinted area would add fuel to the fire.
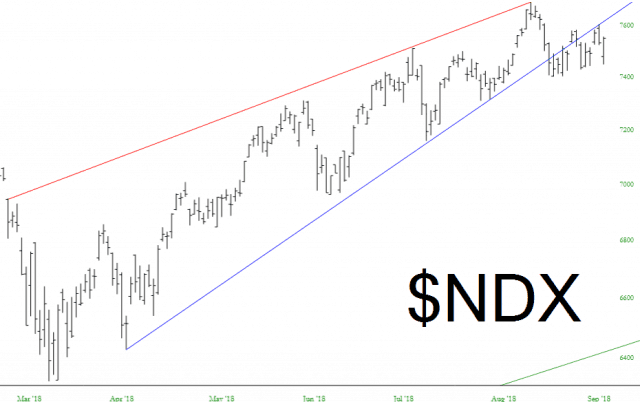
You can see the same trendline damage on the NASDAQ 100. Even with today’s countertrend rally, the index has stayed beautifully beneath broken blue.
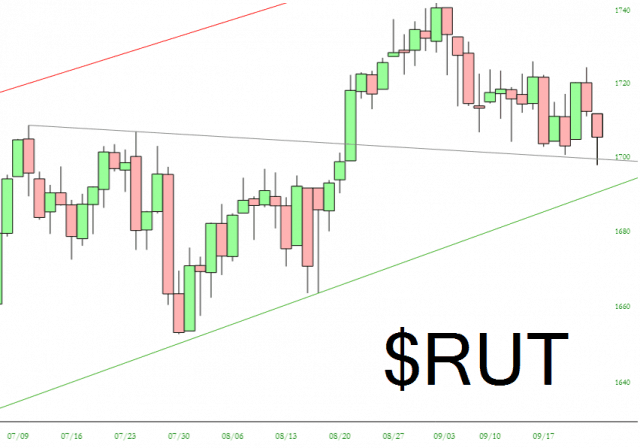
The Russell 2000 is skirting along (for dear life) the symmetric triangle. It is still on the bullish side of a breakout, but it, too, is looking vulnerable.
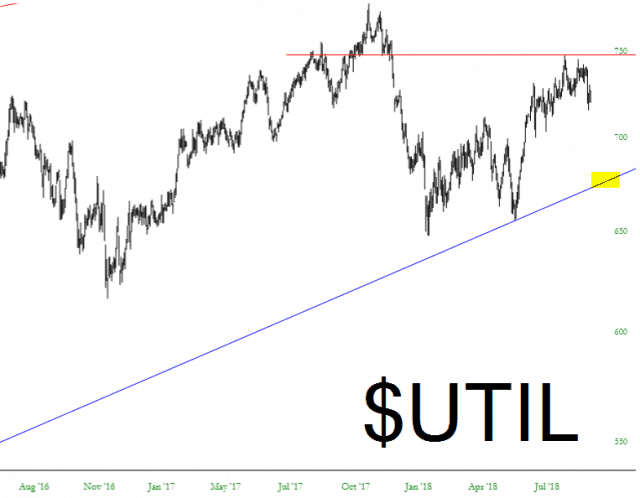
Of course, my hands-down favorite remains the Utilities. I’ve tinted a crucial support line below. I want to be very clear that breaking this level (say, next month) wouldn’t be a multi-week, multi-month, or even multi-year trendline. this one goes back nearly two decades, and it would be the strongest sell signal since – – well – – I’d say about 2008.
I am aggressively short with 70 positions and a 270% commitment.


