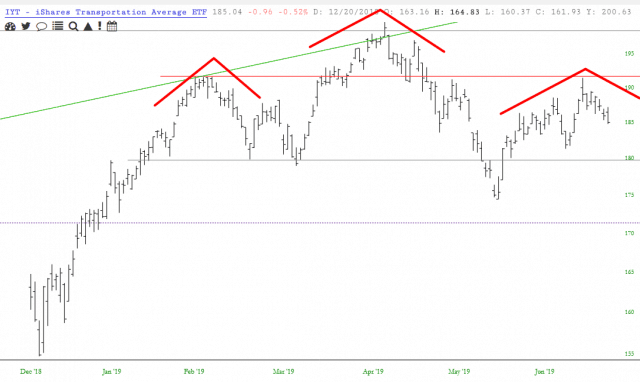
I think the graph speaks for itself. This is a beauty, particularly since it got hammered into a bearish reversal on the Powell Put day.
Slope initially began as a blog, so this is where most of the website’s content resides. Here we have tens of thousands of posts dating back over a decade. These are listed in reverse chronological order. Click on any category icon below to see posts tagged with that particular subject, or click on a word in the category cloud on the right side of the screen for more specific choices.
I think the graph speaks for itself. This is a beauty, particularly since it got hammered into a bearish reversal on the Powell Put day.
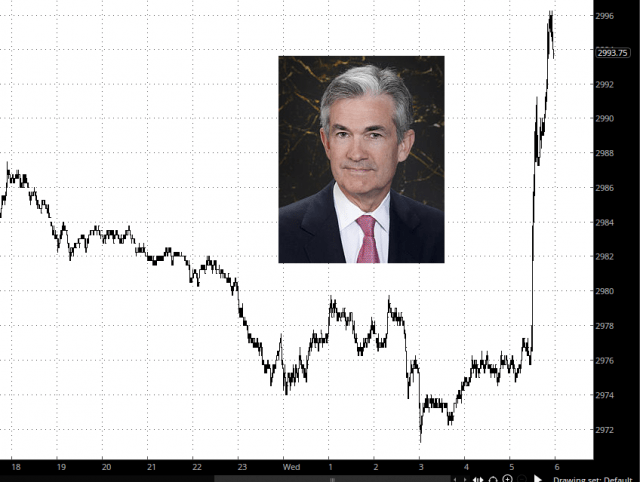
In my post last Friday I was talking about the likely retest coming of the new all time high on SPX (and ES), and how that should set possible daily RSI sell signals brewing on SPX (and ES). We saw that ATH retest and marginal new ATH this morning and I am now looking for a high. It is possible that SPX/ES might go a bit higher but I wouldn’t expect much higher and I’d note that there is already a decent quality double top setup here and that on a sustained break below 2964 the double top target would be in the 2923 area.
(more…)Preface to all editions: I have been in “I can’t believe I forgot this was on Slope” mode quite a lot lately. If I can’t remember all the cool stuff, surely some of you may have forgotten too! In that spirit, here are some reminders:
For myself, I’m going to get some much-needed rest. You can deal with this Powell lunacy on your own.
Natural market forces permitted? NEVER!
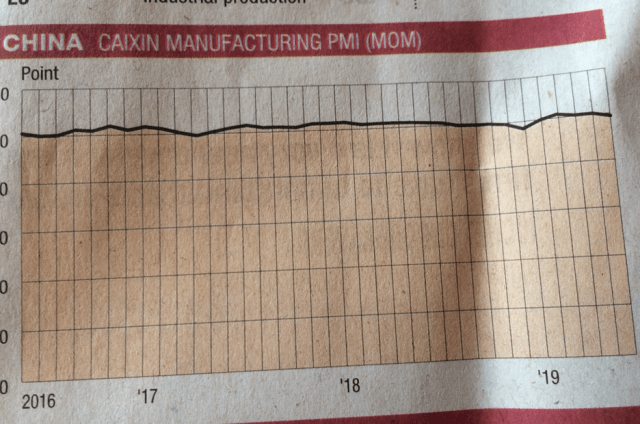
OK, it’s random gripe time. I picked up a copy of the Bangkok Times, and when I got to the business section, there was an article about some economic data from China that had come out. It included this graph: