
Trade Balance data published today (Friday) shows an
increased goods and services deficit for the U.S. and Canada, as shown on the
graphs below.


It remains to be seen
how these countries will grow their exports for 2013. Export demand and currency
demand are important since "foreigners must buy the
domestic currency to pay for the nation's exports…and export demand also
impacts production and prices at domestic
manufacturers."
The U.S. $ remains
in a trading range, as shown on the Weekly chart below, in between the 50
(red) and 200 (pink) smas. At the time of writing this during market hours
today, volumes have increased this week on the current bearish candle — perhaps
signalling/forecasting a further weakening of the dollar in order to stimulate
demand for U.S. goods and services.

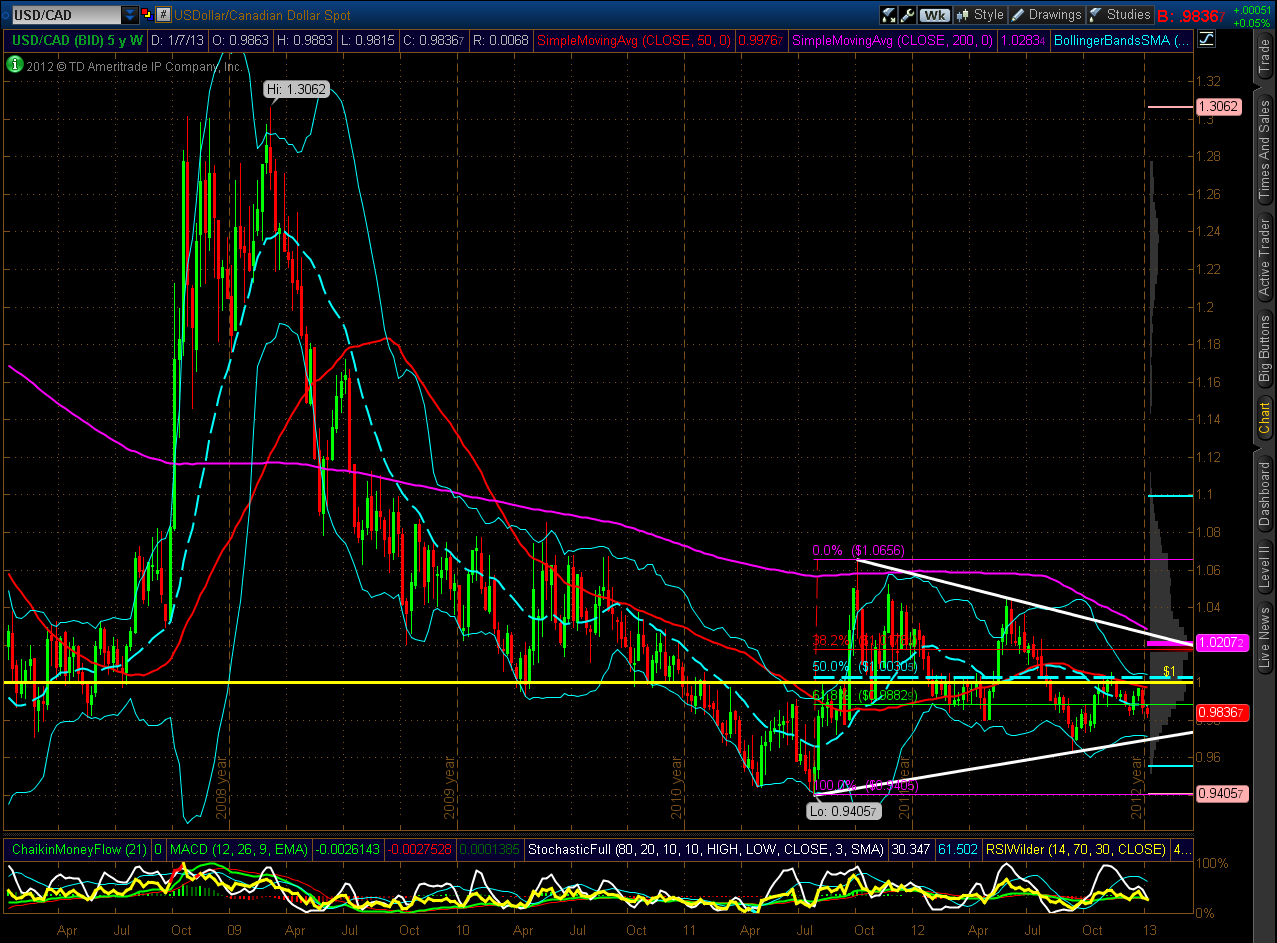
The USD/CAD
forex pair remains in a large triangle formation, as shown on the Weekly
chart below. At the moment, the U.S. $ is weaker and remains below parity.
Rising prices on Oil and Lumber should continue to push the Canadian $ higher
against the U.S. $ — ultimately, favouring U.S. equities, and raising the cost
of new homes, until the demand for them slows.
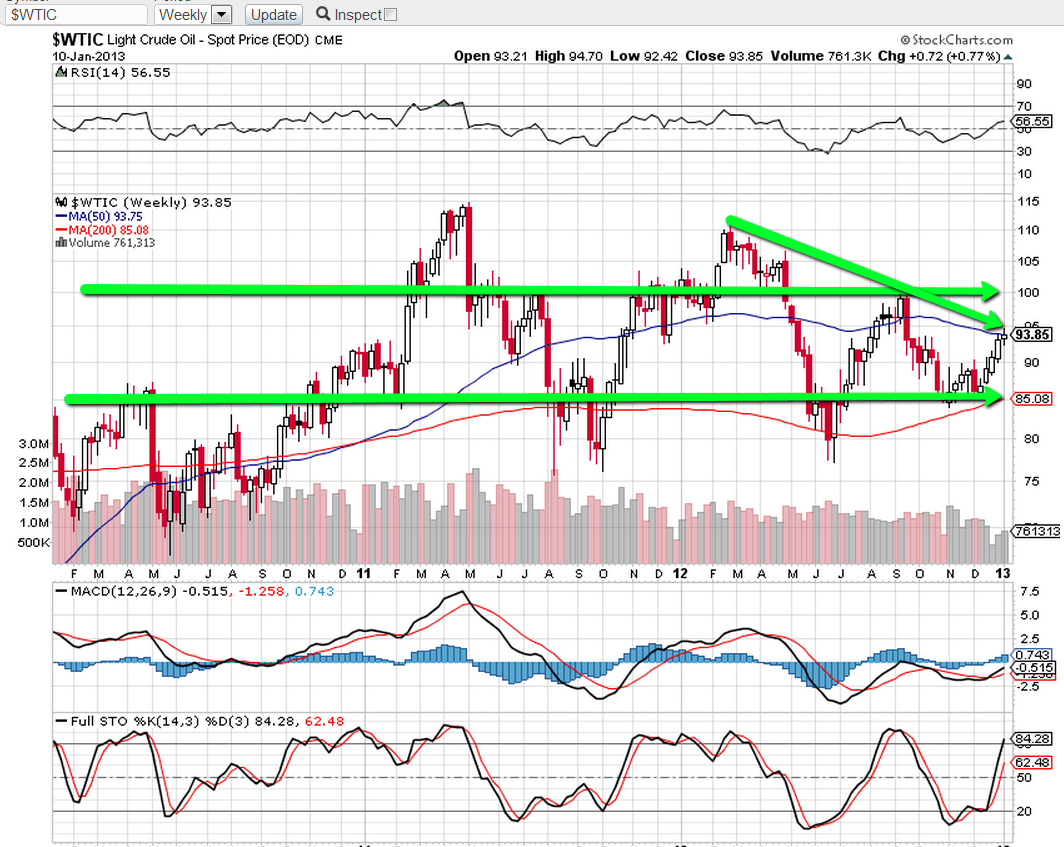
At the moment,
Lumber is at 3-year highs (but the RSI, MACD, and Stochastics indicators
are in overbought territory), and Oil is at resistance (the next major
resistance level is 100), as shown on the Weekly charts below.

The Weekly
chart below of the Homebuilders ETF (XHB) shows a desire of this
market to break out to new 5-year highs, but price is at the top of a
tightly-rising channel. The next major resistance level is around 30.00
— one to watch for further direction, as any serious pullback in this ETF
(and, possibly in Lumber and Oil) may negatively impact the equity market, in
general.

