
My post of January 10th made reference to a 10-Day 30-Minute chartgrid of the YM, ES, NQ & TF. I mentioned that any repeated attempts to advance convincingly beyond last week's high will need to be accompanied by higher volumes. The updated chartgrid below shows, firstly, that the YM has not been able to sustain a breakout above that high, while the ES, NQ & TF advanced today after re-testing this level. Today's initial drop occurred on higher volumes, with the bounce on lower volumes. My prior comments still apply…I'd be looking for higher volumes on any sustained breakout to validate a bullish setup.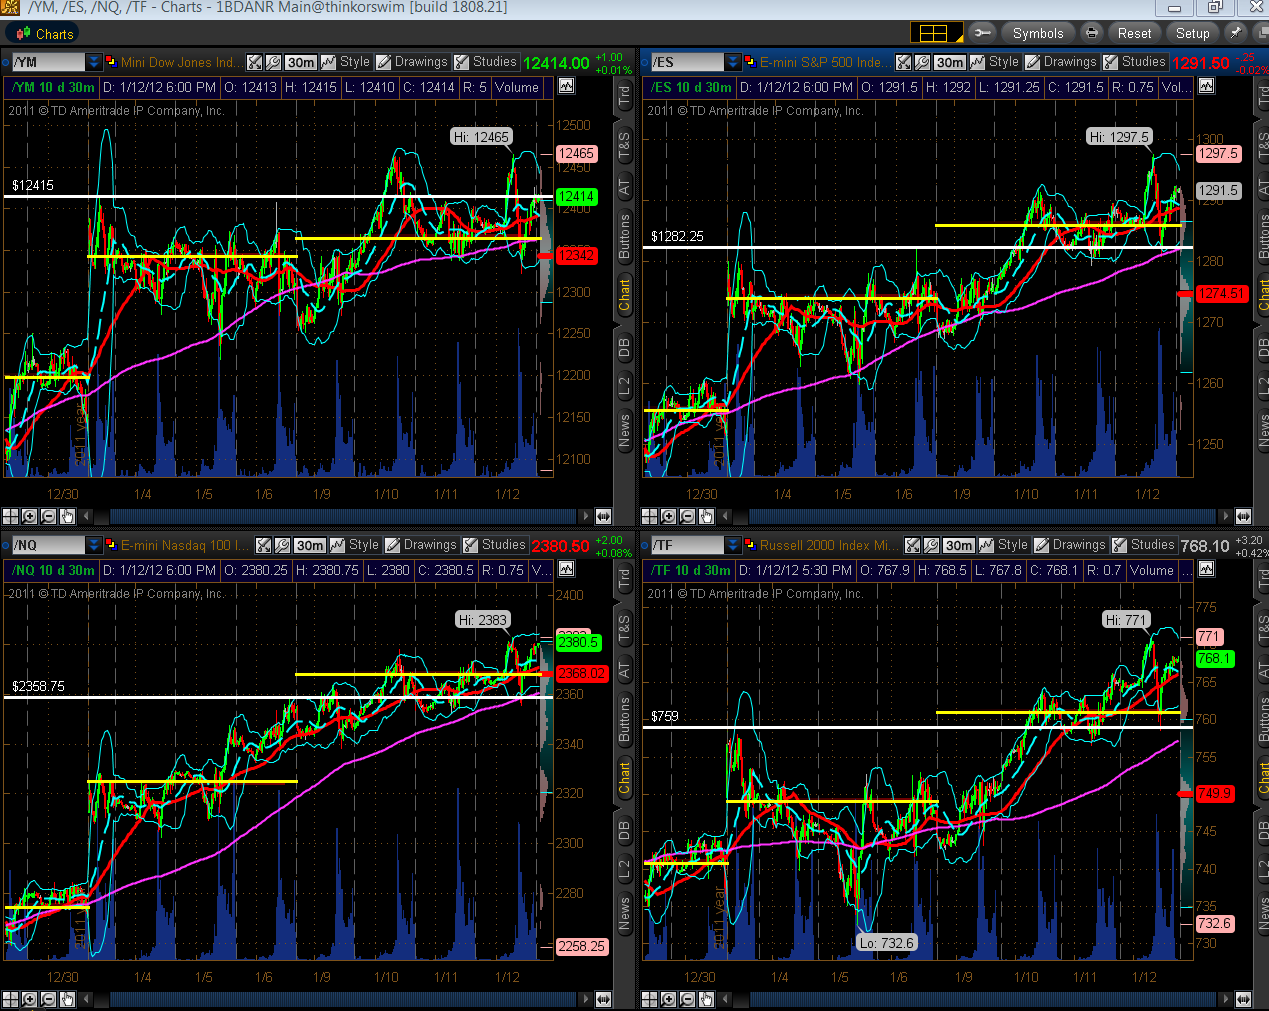
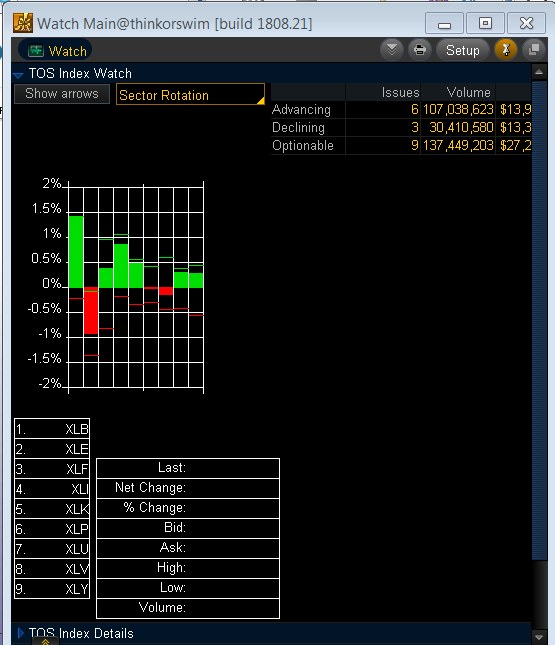
Further to my post yesterday, the Sector Rotation graph below shows today's action on the Major Sectors. Materials was the big gainer, while Energy was the big loser…money continued to flow into the "Risk" sectors, as well…will see if money continues to flow into "Risk" on any further advance on YM, ES, NQ & TF.
The 4-Hour chart below of Gold shows that it ran into confluence resistance (Fibonacci, price, and a high volume level on the Volume Profile at the right edge for the entire 180 days) at 1660 today. This is a major resistance level and the advancing volumes were steady, so will see if further risk appetite continues in this market, and what happens to volumes.

The 4-Hour chart below of Oil shows that it dropped into Volume Profile POC (for both last month and for the entire 180 days) and Fibonacci confluence support today. It has failed, once again, to hold the 102.00 level that I last mentioned in my post on December 29th, 2011. The increase in volumes this year, together with today's drop below this year's range, suggests that a topping process has begun…a chart I'll continue to watch over the next days/weeks.

http://strawberryblondesmarketsummary.blogspot.com/
