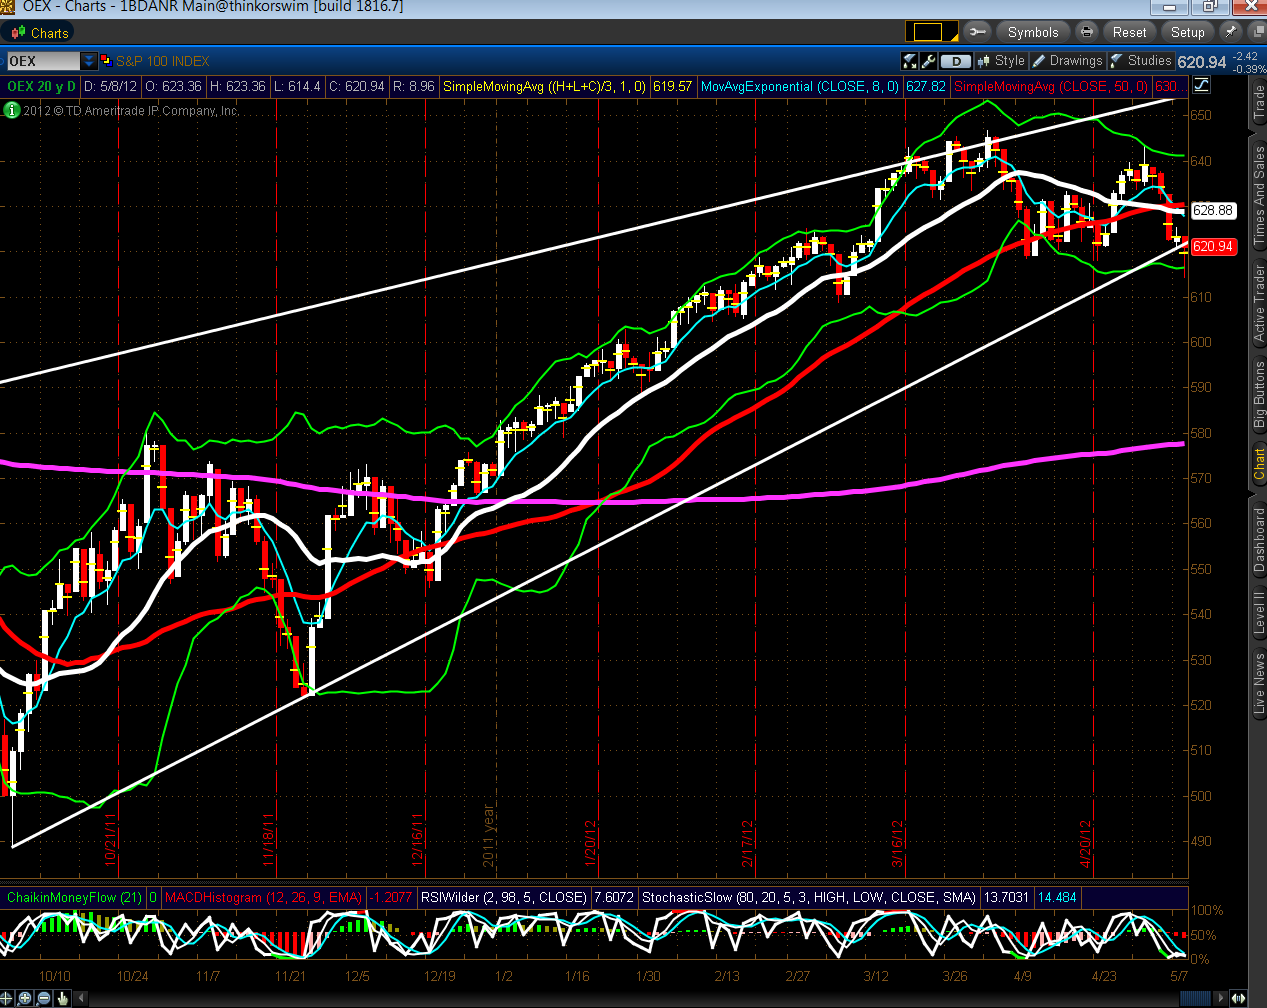
Charts of interest that I'm watching over the next few days are shown below…action of late has been in favour of the bears (except the U.S. $)… (of particular interest is Tuesday's break and close below the uptrend line on OEX).
Slope initially began as a blog, so this is where most of the website’s content resides. Here we have tens of thousands of posts dating back over a decade. These are listed in reverse chronological order. Click on any category icon below to see posts tagged with that particular subject, or click on a word in the category cloud on the right side of the screen for more specific choices.
Charts of interest that I'm watching over the next few days are shown below…action of late has been in favour of the bears (except the U.S. $)… (of particular interest is Tuesday's break and close below the uptrend line on OEX).
Originally published on MPTrader.com.
I've done plenty of analog posts in the past. For some reason, Slopers seem to bristle at analogs. I'm not sure why; I'm pretty good at them. My GDX and EUR/USD analogs have both been considered "brilliant"………"breathtakingly prescient"…..and "inspired." The fact I can attribute these quotes to myself should take nothing away from their gravity.
My well-honed eyes noticed another analog today with the New Zealand Kiwi cross-rate (NZD/USD). Take note of the 2007-2008 period, shown below, and the tinted areas:
Here is a new, novel, and different trade idea: short treasuries. Wait, people have been saying that interest rates have to eventually go up for the last several years? And the most powerful financial force on the planet, the Fed, has been pinning interest rates as low as possible? Hmm, well in that case SHORT TREASURIES.
Every great trade has a technical and fundamental backing but it also has a great story for why now. United States Treasuries have finally painted a beautiful picture for why they will fall and interest rates will rise.
First, let us look at the Fed. The Fed can do one of two things. They will continue an endless stream of quantitative easing thus interest rates will stay where they are now. Or they slow down their constant manipulation and interest rates not only rise but rip back to historical norms. Heads, I win, tails, its a tie.
Data released on May 7th shows that consumer debt levels rose again and are now at their highest levels since January 2000, as shown on the graph below.
As you can see, the "boom and bust" swings have been steadily widening since that time, which indicates "increasing volatility" in this type of psychological behaviour…some may call it "unstable and unsustainable."

