
SPX took the green pill yesterday, breaking over the double-bottom trigger level and making the double-bottom target and more by the end of the day. Is the retracement low then in? Not necessarily but the odds that the low is in have obviously increased considerably. On the SPX daily chart it's worth noting that both of the main highs in 2012 were followed shortly afterwards by retracements to the lower daily bollinger band and bounces back to the top. However I don't think the current high was a main high. SPX closed 5 points over the daily middle bollinger band and if we see more upside the obvious target is at the daily upper bollinger band in the 1532 area:
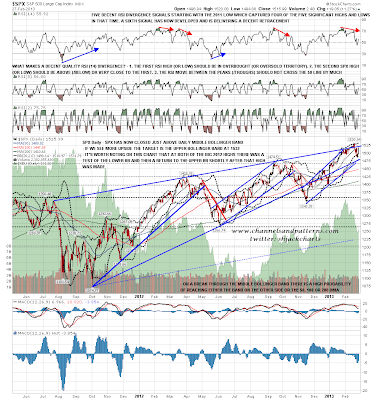
There wasn't any positive divergence on the SPX 60min RSI at the low this week but there was on the 15min chart, so I'll show that today. As you can see SPX fell just short of declining resistance from the high yesterday and if the setup on this chart is a broadening descending wedge then the obvious target would be there:

ES has reached the equivalent declining resistance there and is showing some negative divergence on the 60min RSI. The chances are that we see some retracement here and primary support is at the important 1510/1 level. Secondary moving average support is in the 1504 area and if we see a break below 1500 then the chances are that a new move down to at least test the current low has started:

The big news yesterday though was that a Vix Buy (equities) Signal was confirmed. These have a mixed record historically, and the only confirmed Vix Sell (equities) Signal on the chart below was a complete washout, but it's worth noting that the last four confirmed buy signals have all delivered the goods as you can see on the chart below. Vix is still above daily middle bollinger band support at 14, but if we see a close significantly below that would also be a significant signal that another move up is in progress:

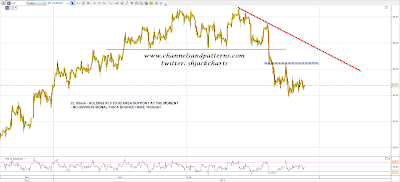
CL is still holding important 91.3 to 92 area support but has not bounced in sympathy with SPX as yet. The next move should give more clues as to direction but there's not much to see right here:
EURUSD broke over the double-bottom trigger level overnight but has found resistance at established 1.3157 area resistance so far. The pattern target is 1.323 if EURUSD can break over that:

For this morning I'm expecting some retracement of yesterday's run up on ES. If we see a conviction break below 1510 then the bears are in with a shot at more downside to a lower low. If it holds and SPX/ES break the last high, then the retracement low should already be in. The stats for the last day of the month lean somewhat bearish, and the stats for the first day of the month tomorrow lean strongly bullish.
