
The high on SPX yesterday was at 1573, just shy of the intraday 2007 high at 1576.09. I was saying to a friend yesterday morning that the ideal place for a high here, if we are going to see a high here, is at 1576 plus or minus 4, and we hit that yesterday, but ideally we would see the high tested and slightly exceeded. This is the last chance to see a reversal at an established resistance level, as above 1576.09 is blue sky territory.
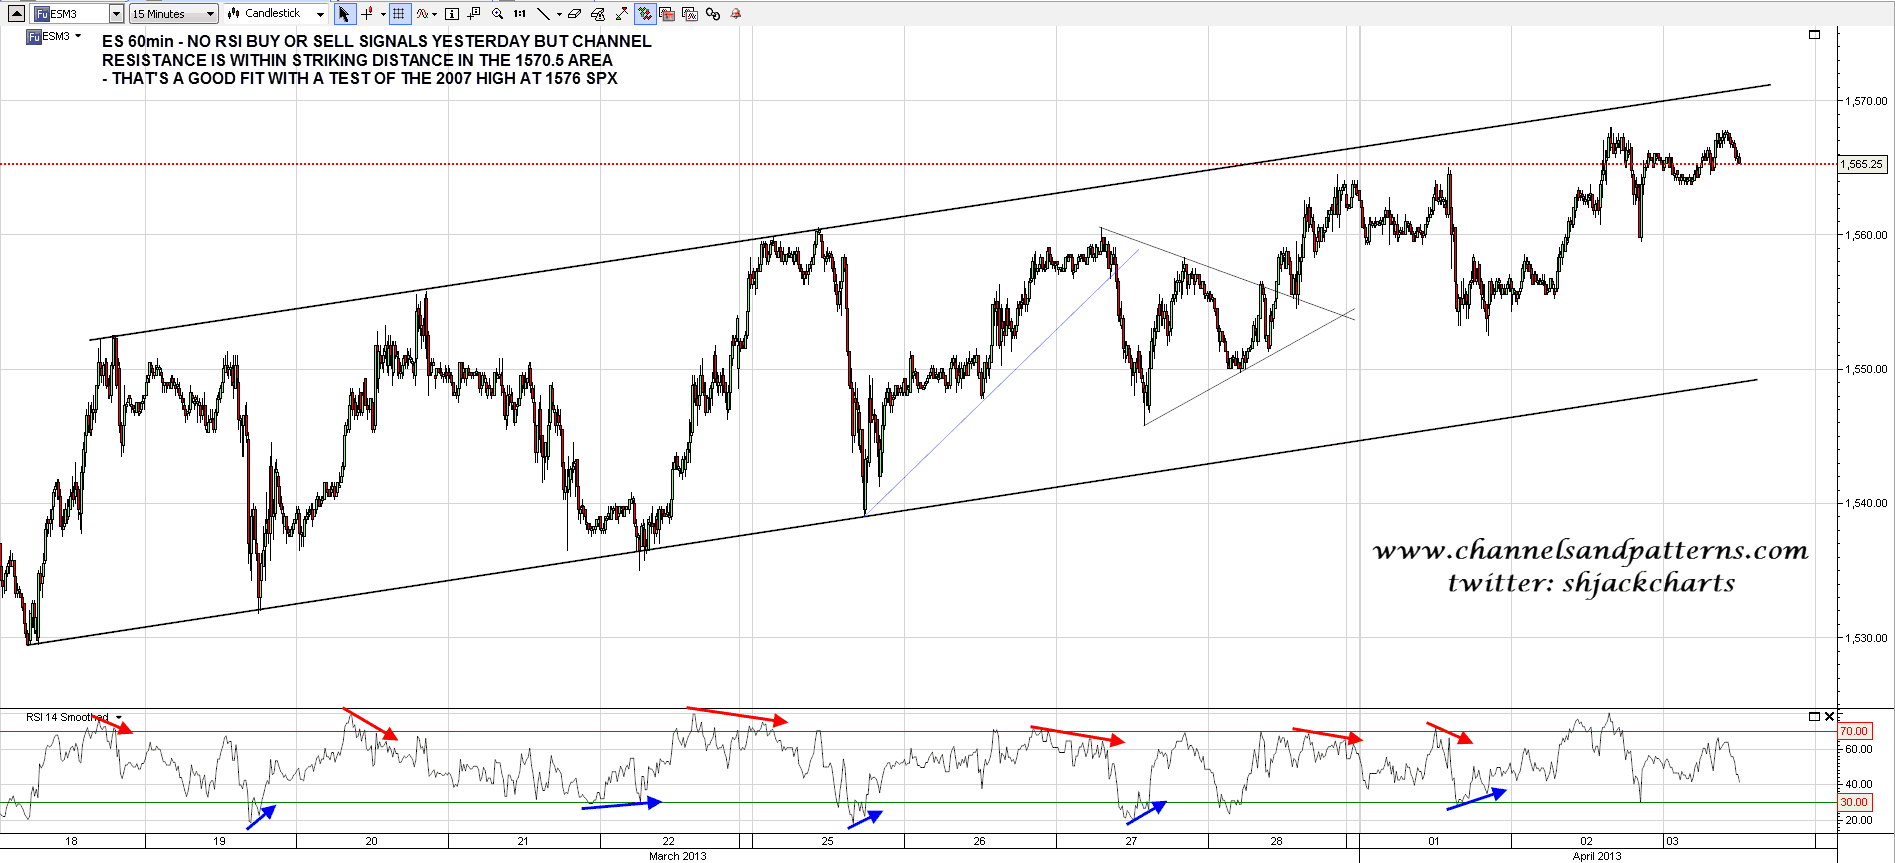
On ES there were no RSI signals yesterday, but ES is within striking distance of channel resistance in the 1570.5 area, and that is a decent fit with a test of the 2007 high on SPX:
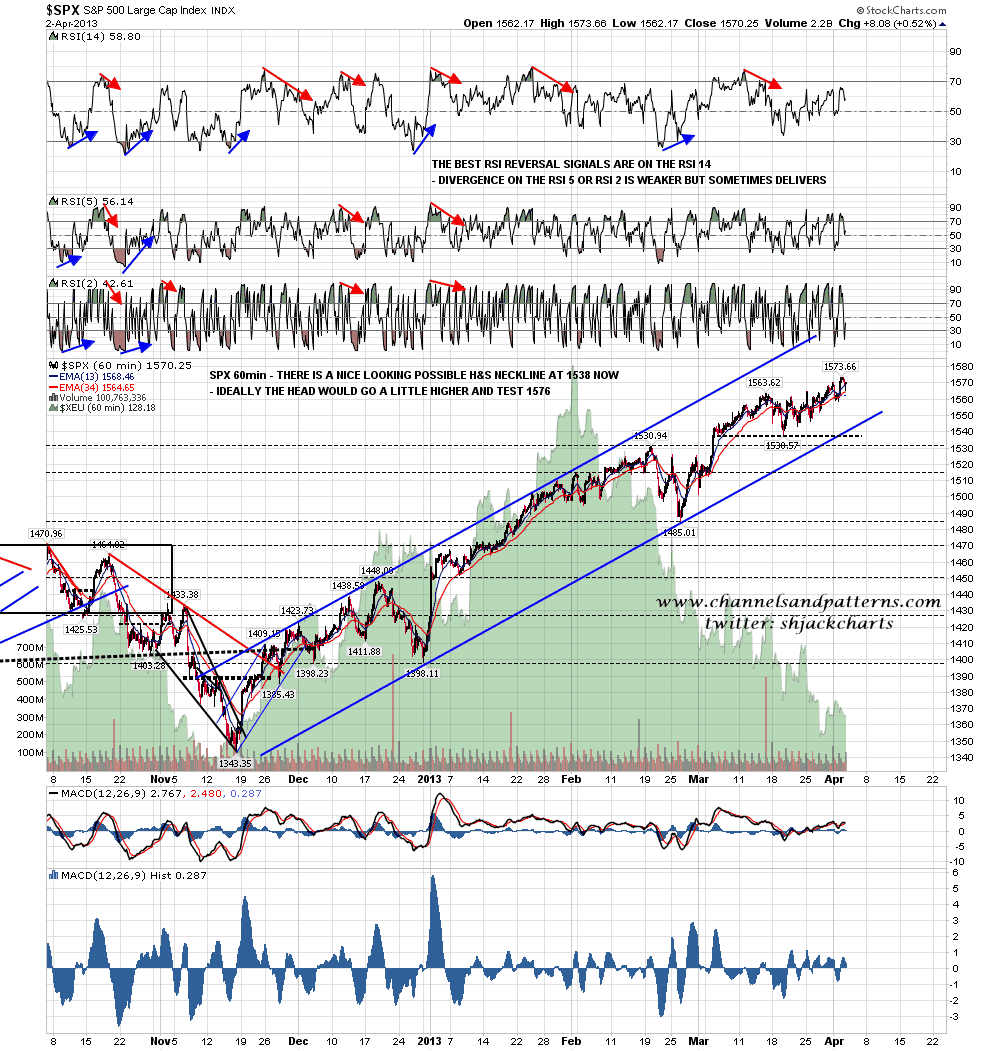
Channel support on SPX is now clearly above the possible H&S neckline at 1538, so a hit there would break the channel:
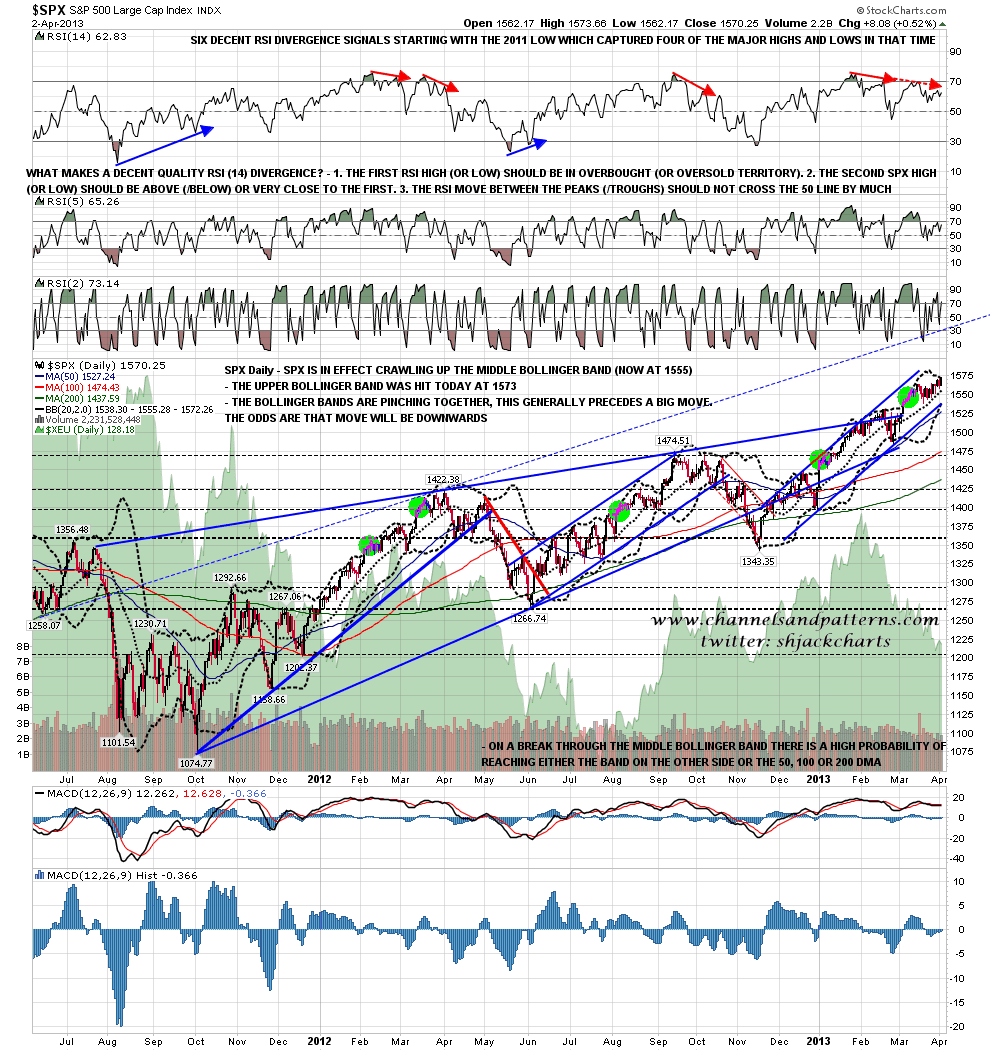
The daily SPX bollinger bands are still pinching together and the upper bollinger band was hit yesterday. There is still strong negative daily RSI divergence on this chart which supports reversal here:
I noted the relative weakness on the TRAN chart yesterday. RUT is also looking weak here and broke below rising support yesterday. Again, there is strong negative RSI divergence on the daily chart:

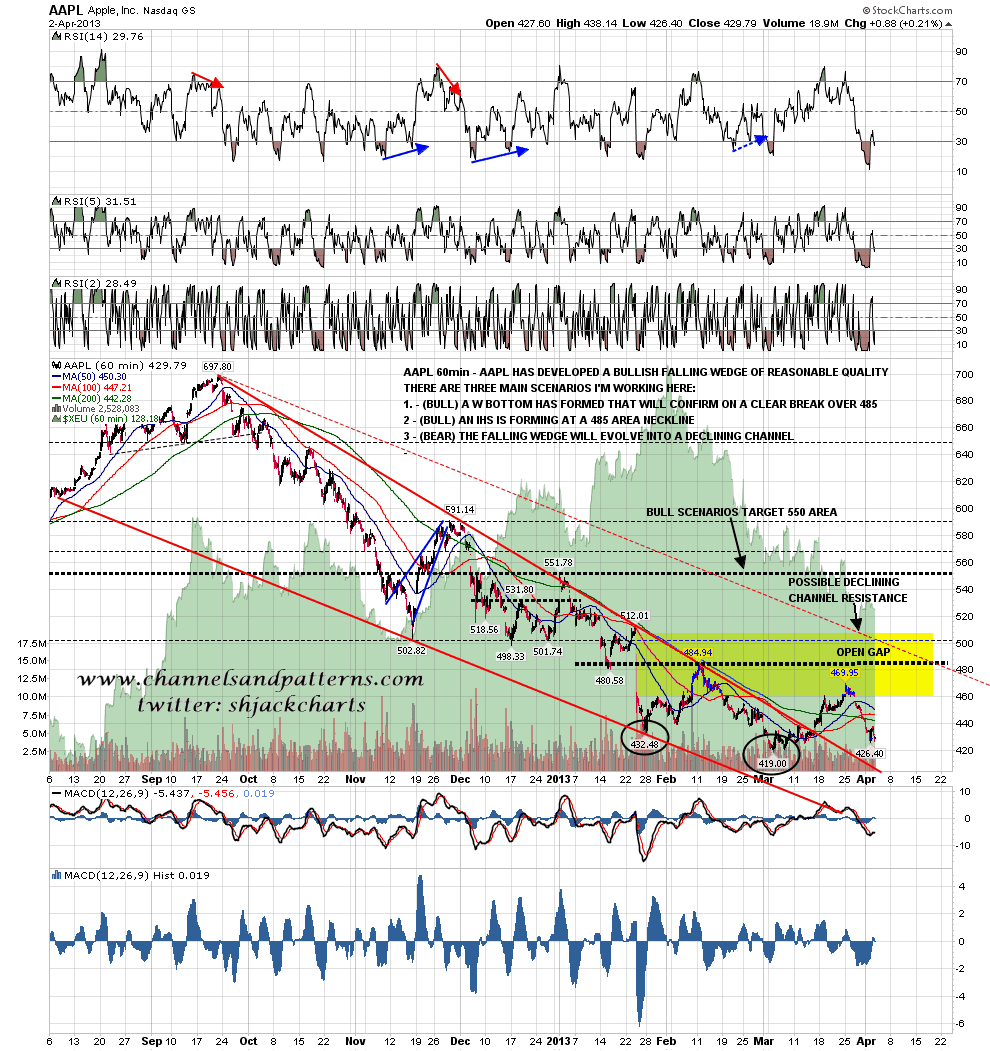
AAPL rallied a bit yesterday. I’ve left the comments on the chart that I put on a week ago. What’s changed since is that the bull IHS scenario has become less likely in my view but this will still look like bottoming action overall unless a confident new low is made. hat said, AAPL is clearly still making lower lows and highs at the moment:
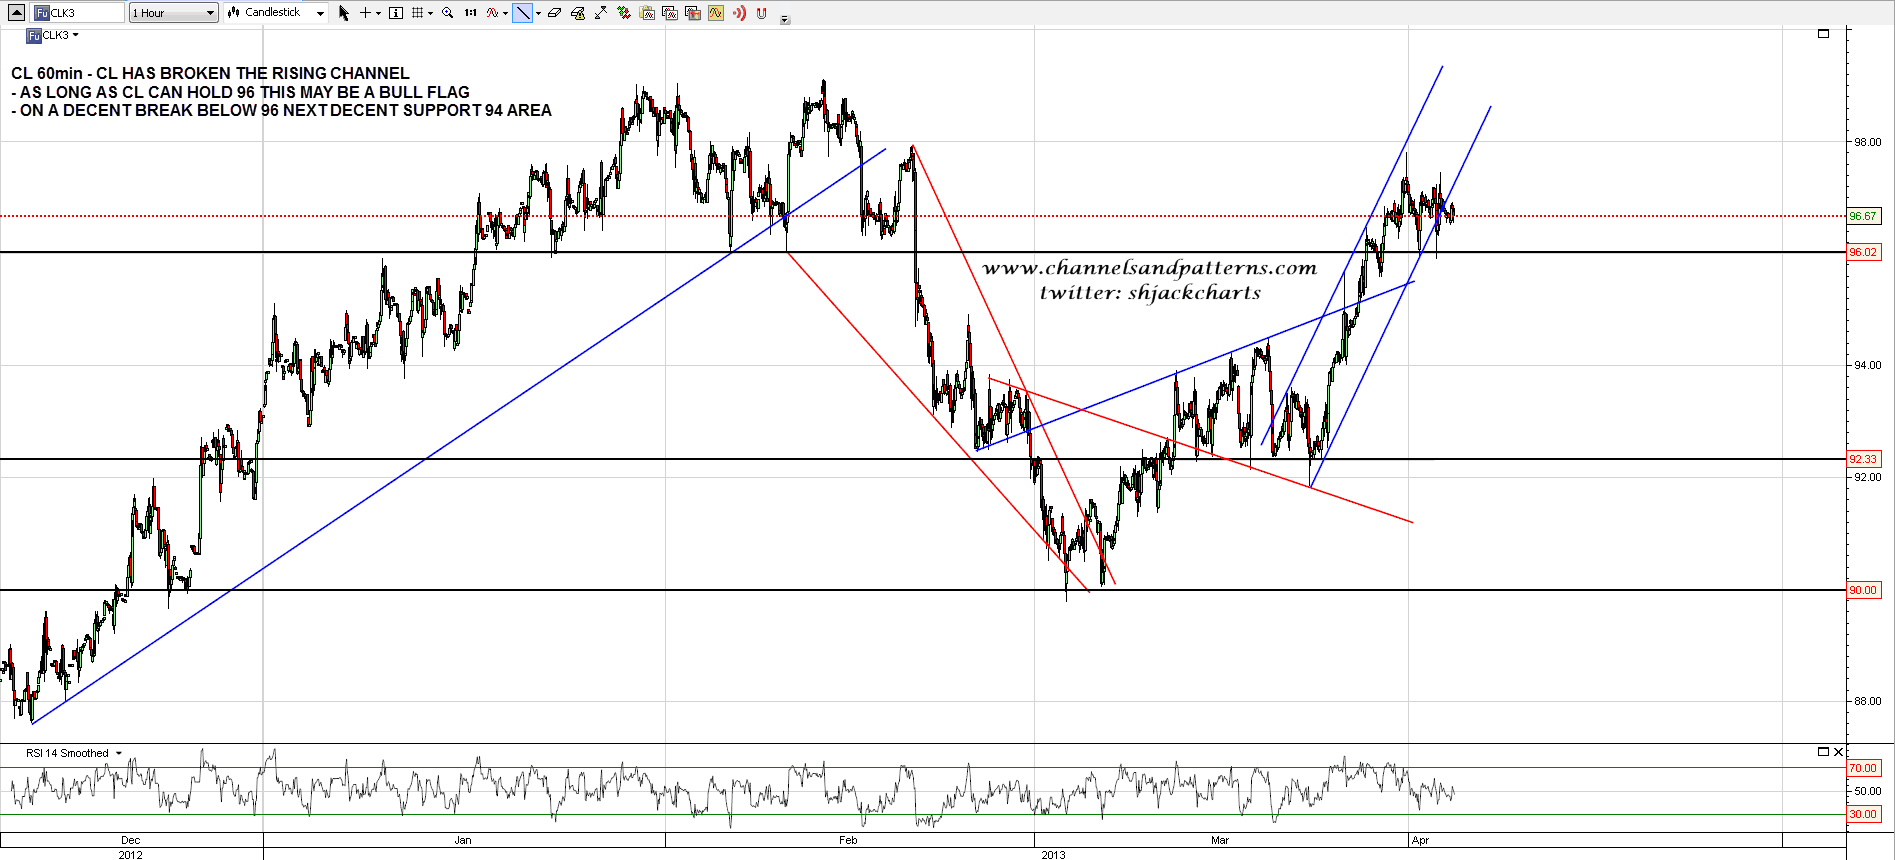
CL broke yesterday’s newly minted rising channel and the trend is in some doubt. As long as 96 holds this could be a bull flag. On a clear break below the next support levels are in the 94 and 92 support areas:
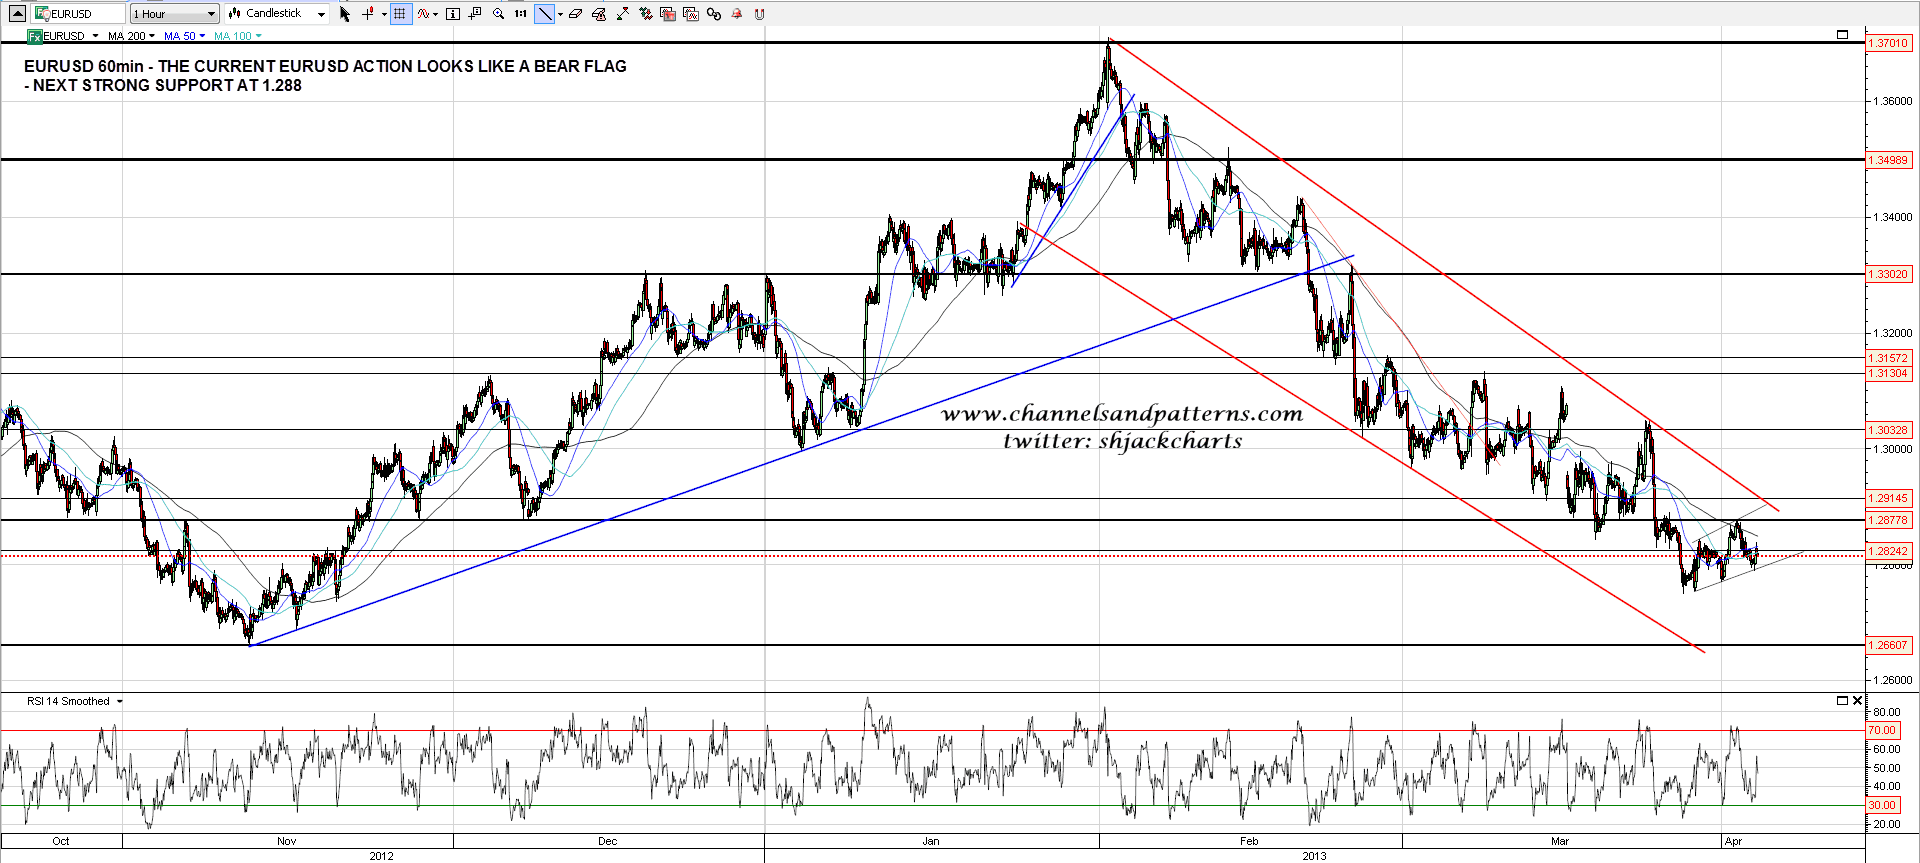
The current move on EURUSD is looking like a bear flag, and on a break of flag support I’ll be looking at 1.266 support. That’s a big support level:
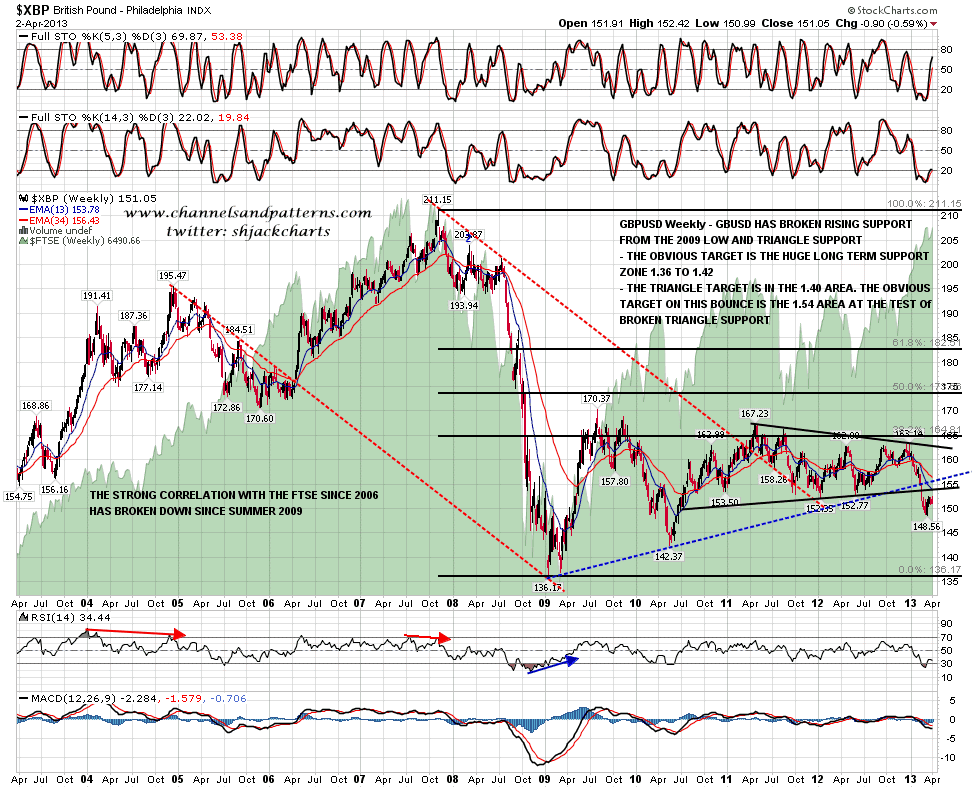
To put what is most likely happening on EURUSD here into context I’ll show the GBPUSD chart, where a 3 year triangle recently broke down with a target in the 1.40 area. The current rally looks like a retest of that triangle with the likely upside target in the 1.535 to 1.54 range before the downtrend resumes. In this context what we are most likely seeing on EURUSD here is consolidation, and the reason it isn’t bouncing further is that the Cyprus debacle will be prompting many to move their deposits and bond holdings away from weaker EU members, with much of that money leaving the EU. That’s likely to be putting downward pressure on the Euro for quite a while yet:
I might be giving the impression here that I think bank depositors and bondholders losing their money is an inherently bad thing, and that’s not the case at all. I just think that should have been done extensively in 2008-10 rather than the liabilities being assumed by taxpayers then, and that opportunity was missed. To do it now when much of the EU banking system is teetering on the edge of insolvency, and is stuffed with government bonds that in many cases may become largely worthless in the event that the Euro area breaks up is just rank stupidity, as it has started a slow run on EU banks that may well trigger the collapse that the EU has so far gone to such great lengths to avoid. Bad things can happen though when children play with loaded guns.
For today on ES I have support in the 1559 to 1561.50 range, and resistance in the 1570.5 to 1571 area. A conviction break below 1559.5 ES would trigger a small double-top with a target in the 1551 area. ES channel support is in the 1549.50 area. This is my first post on this wordpress editor, comments welcome on chart sizes etc.
