
On Monday morning I gave a twenty handle inflection range on SPX, bracketed by important gaps above and below at the possible breakaway gap above from Friday’s close at 2383.12, and the open gap below from 2263.64. Since then SPX has resolutely stayed within that range, and is almost in the middle of the range at the time of writing. So far, so boring, but time is no friend to the bulls here. If we don’t see a break up towards ATH retests today or possibly tomorrow, then the window of opportunity to see those retests may well be over.
I won’t show the futures charts today but on all of ES, NQ & TF yesterday morning’s falling wedges that had broken up evolved into larger falling wedges, that have now all also broken up. Key resistance is still at the weekly pivots on ES (2379.75) and NQ (5363.25), and conversion of these levels to support opens the ATH retests there. We’ll see, NQ is currently above the weekly pivot there though that’s not the first attempt to convert it.
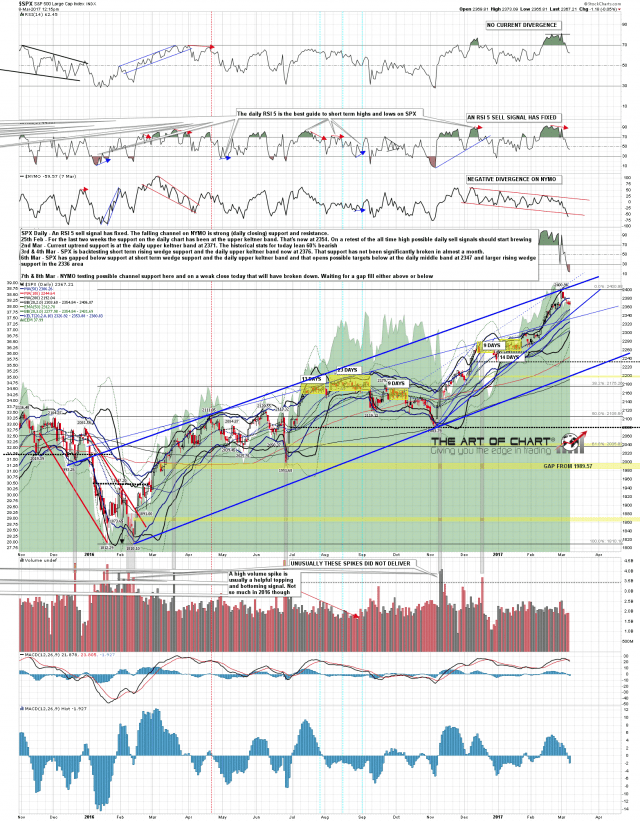
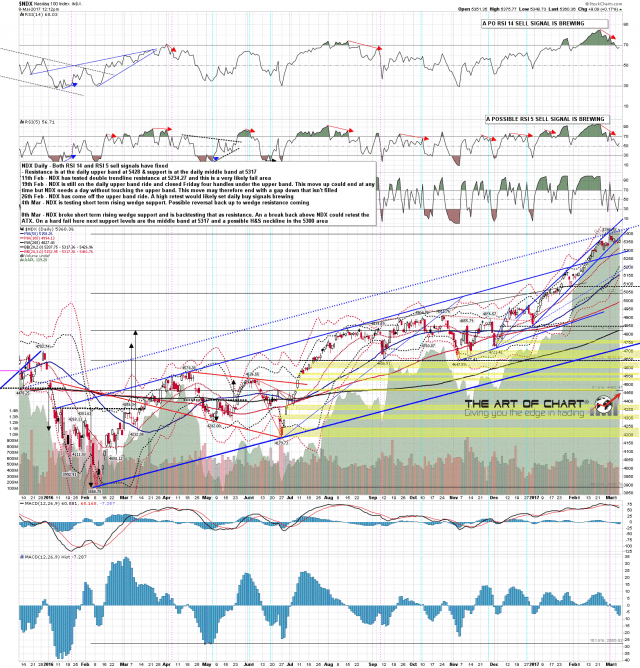
Given the lack of meaningful movement so far this week I’m going to take the opportunity to review the overall setups on the SPX, NDX and RUT daily charts.
SPX is on a daily RSI 5 sell signal and has three support trendlines in play on the daily chart. The first has broken and subject to a possible high retest. SPX is likely on the way to the second support trendline, currently in the 2344 area. On a fill of the open gap below that would be the obvious next trendline target. On the bigger picture rising wedge support from the Feb 2016 low is now in the 2200 area. SPX daily chart:
NDX is on both RSI 14 and RSI 5 daily sell signals and has broken first rising wedge support, with a backtest of that as resistance today that is holding so far. On continuation down the next trendline support is in the 5175 area, with rising support from the Feb 2016 low now in the 4710 area. NDX daily chart:
RUT was on both daily RSI 14 and RSI 5 sell signals, but the RSI 5 sell signal made target yesterday. That is most definitely the most bearish looking of the three, having broken double top support at 1380 at the close yesterday, with a target on a sustained break below in the right area for a backtest of the 1347.20 high. There is a possible H&S neckline below in the 1310 area, and rising channel support from the Feb 2016 low is in the 1245 area. RUT daily chart:
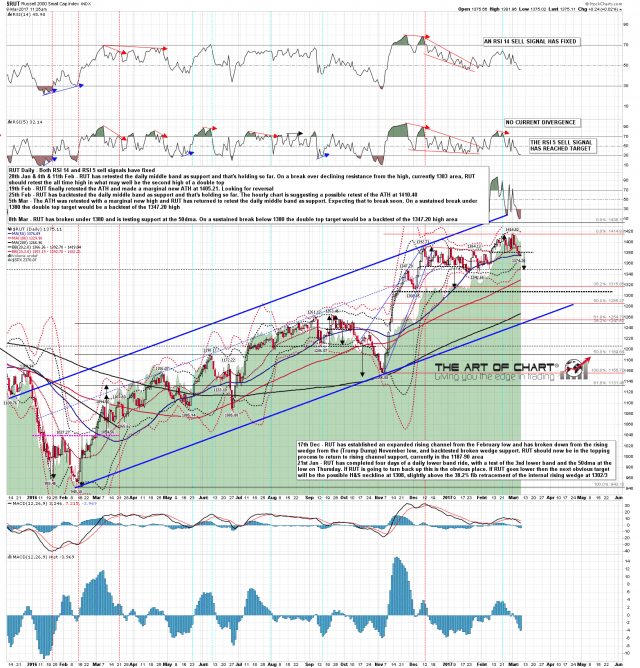
Whichever way this goes short term the swing highs are likely made, barring possible topping retests, and the next significant moves should be down.
