
The falling channel broke up on SPX yesterday but held channel resistance on ES and turned back down. SPX is now testing the possible reversal level at rising wedge support from the early November low. At minimum the bounce from there so far confirms and strengthens that support trendline, but this often happens just before a break so we’ll see whether the trendline holds the rest of today. If it does then ES channel resistance is now in the 2369.50 area (approx 2372.75 SPX), and the 50 hour MA is now in the 2370.5 SPX area. SPX 60min chart:
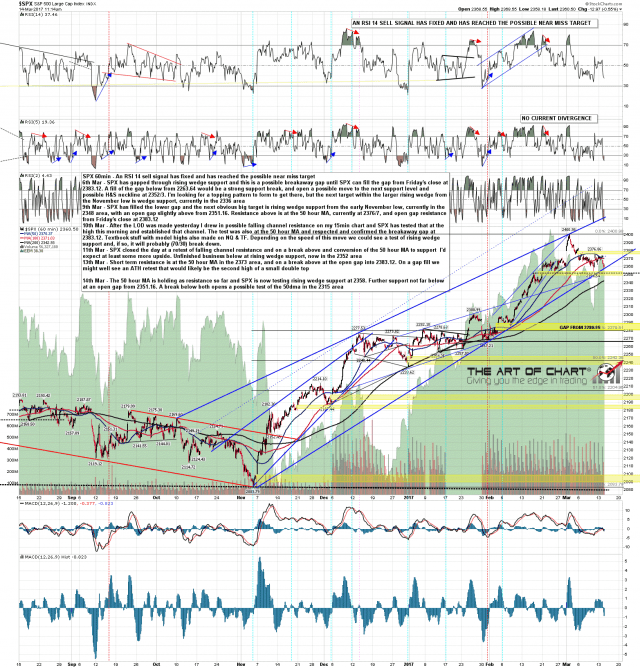
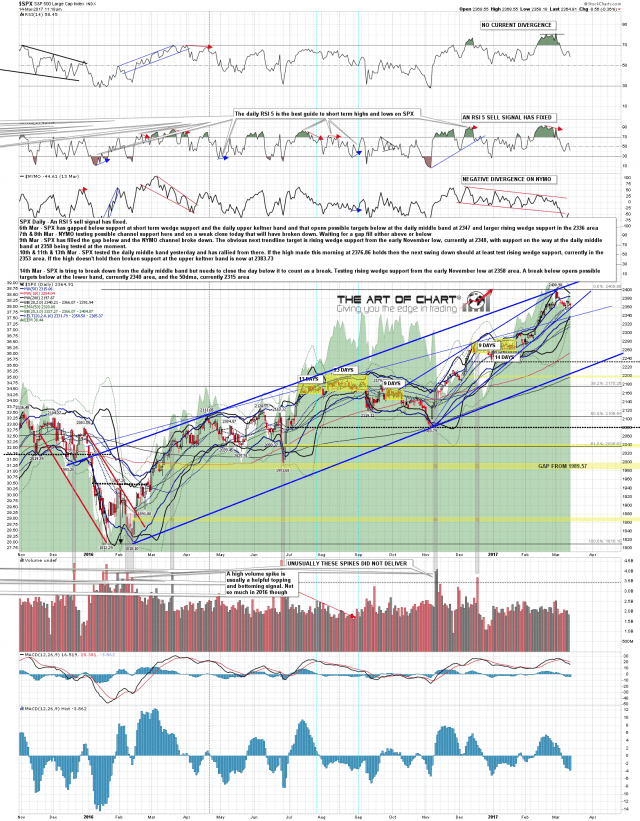
On the daily chart the key level today (closing basis) apart from that rising wedge support is the middle band, currently at 2366. SPX daily chart:
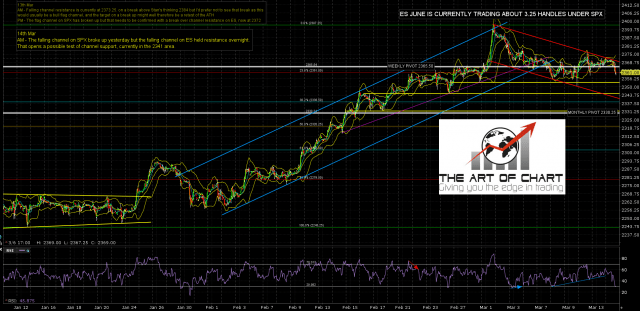
If ES is going lower then flag channel support is currently in the 2341.5 area. ES Jun 60min chart:
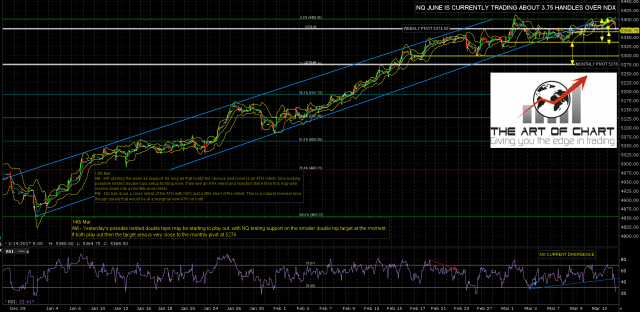
NQ is at an interesting stage here, with the nested double tops that were forming yesterday testing support on the first and smaller double top. There is a possible path in place on NQ to retrace all the way back to the monthly pivot at 5276. NQ Jun 60min chart:
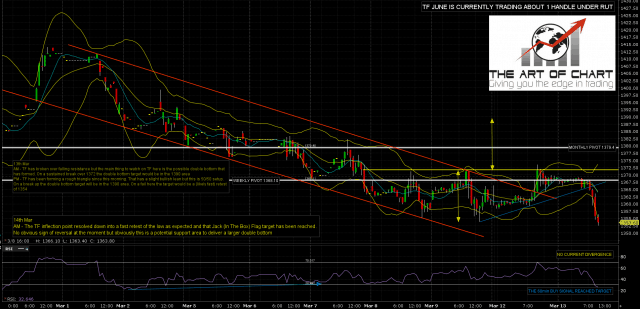
Yesterday’s double bottom setup on TF broke up slightly and then failed into a lower low. TF is at an inflection point here to either continue lower or bottom out having made the second low on a slightly larger double bottom. TF Jun 60min chart:
If rising wedge support holds then SPX has made the retracement low this morning. If that trendline breaks then lower targets open up. As I was saying yesterday morning, the short term cycles favor lower, so I’m leaning short unless we see SPX break back over 2373.
Stan and I have started doing regular public (free) webinars at theartofchart.net on our Big Five Service stocks – AAPL, AMZN, FB, NFLX and TSLA, and the next one is tomorrow after the close. If you’d like to attend you can register for that on this page here.
