Slope of Hope Blog Posts

Slope initially began as a blog, so this is where most of the website’s content resides. Here we have tens of thousands of posts dating back over a decade. These are listed in reverse chronological order. Click on any category icon below to see posts tagged with that particular subject, or click on a word in the category cloud on the right side of the screen for more specific choices.

SPX Cycles, Fed Funds and Gold

By -

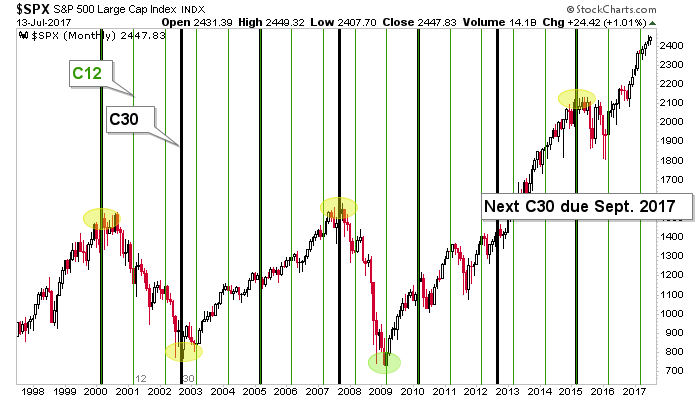
This “amateur cyclist’s” chart (I am anything but a cycles analyst) of the S&P 500 shows that the 12 month marker (C12) meant exactly nothing as the market remained firmly on trend, after brief pokes down in April and May. We noted that C12 was a lesser indicator than the 30 month cycle, which has coincided with some pretty significant changes (+/- a few months). That cycle (C30) is coming due at the end of the summer. Will it mean anything? Well, this market eats top callers for breakfast, lunch, dinner and midnight snacks. But it is worth knowing about to a lucid and well-armed market participant.

spx cycles

(more…)

A Tale Of Two Bull Flags

By -

SPX and NDX both delivered breakaway gaps up on Wednesday that were not filled. Both of the possible bull flags that I was looking at on SPX/ES and NDX/NQ as the lower probability alternate on Wednesday morning broke up, and SPX and ES have made the minimum bull flag targets at the full retests of their all time highs this morning. So what now?

This is a smaller but still significant inflection point here at the marginal new all time high on SPX/ES. The possible SPX daily RSI 5 buy signal that I was looking at on Wednesday morning fixed and has made target, and it’s possible that SPX / ES will make marginal new highs here in the second highs of double tops. If so, ideally, there would be a pullback in this area and then marginal higher highs to set up a daily RSI 5 sell signal on SPX.

(more…)

Fourth Approach

By -

The emerging markets fund has soared almost 50% since the beginning of last year. That’s a pretty amazing performance for such a broad base of equities.

I would like to point out – – for what it’s worth (which isn’t necessarily that much in today’s QE-fueled world) this is the fourth time prices have approached the red trendline drawn below, each of which has carved out a slightly lower high. We shall see if a fourth descent begins, as before, or if at last this breaks above the resistance.

0714-EEM