Slope of Hope Blog Posts

Slope initially began as a blog, so this is where most of the website’s content resides. Here we have tens of thousands of posts dating back over a decade. These are listed in reverse chronological order. Click on any category icon below to see posts tagged with that particular subject, or click on a word in the category cloud on the right side of the screen for more specific choices.

Red History Month

By -

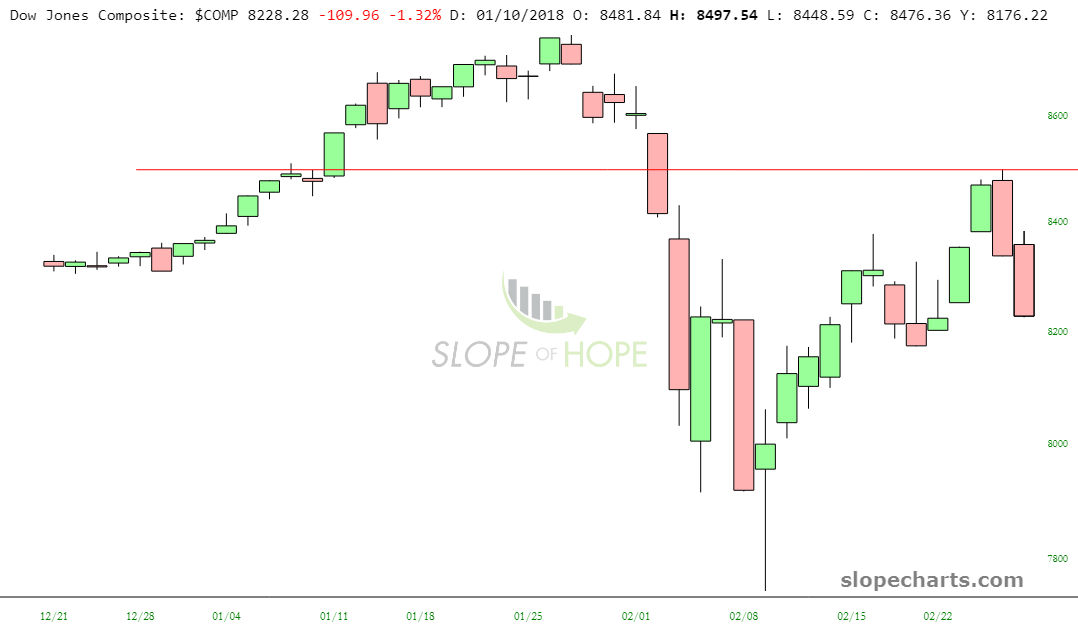
Well, this is the first down month we’ve had since President Courageous Super Business Guy Deal-Making Genius got elected. It’s almost impossible to believe, but we haven’t had a single down month since October 2016. This is also the biggest loss for a February since 2009. Needless to say, I’m pleased we’ve broken this streak. We can see quite plainly the top, the drop, the recovery, and – –  God willing – – the resumption of weakness.

slopechart_$COMP


(more…)

S&P 500 Index: Near-Term Trendline Apex Support Levels

By -

The following daily chart (and close-up shot) of the S&P 500 Index is criss-crossed by a number of trendlines. There are a couple of near-term price levels where these intersect at their apex (2730 and 2685). Should both of these be breached with force, we’ll likely see another leg down.

My last post referencing the SPX:VIX ratio offers further details that would corroborate such a downward event…worth monitoring in the days/weeks ahead.

(more…)