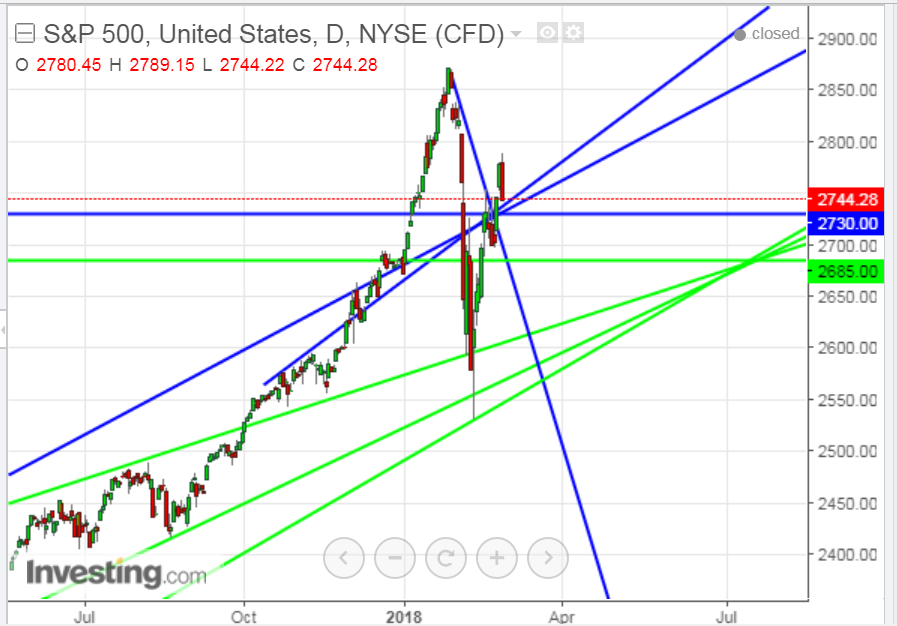
The following daily chart (and close-up shot) of the S&P 500 Index is criss-crossed by a number of trendlines. There are a couple of near-term price levels where these intersect at their apex (2730 and 2685). Should both of these be breached with force, we’ll likely see another leg down.
My last post referencing the SPX:VIX ratio offers further details that would corroborate such a downward event…worth monitoring in the days/weeks ahead.

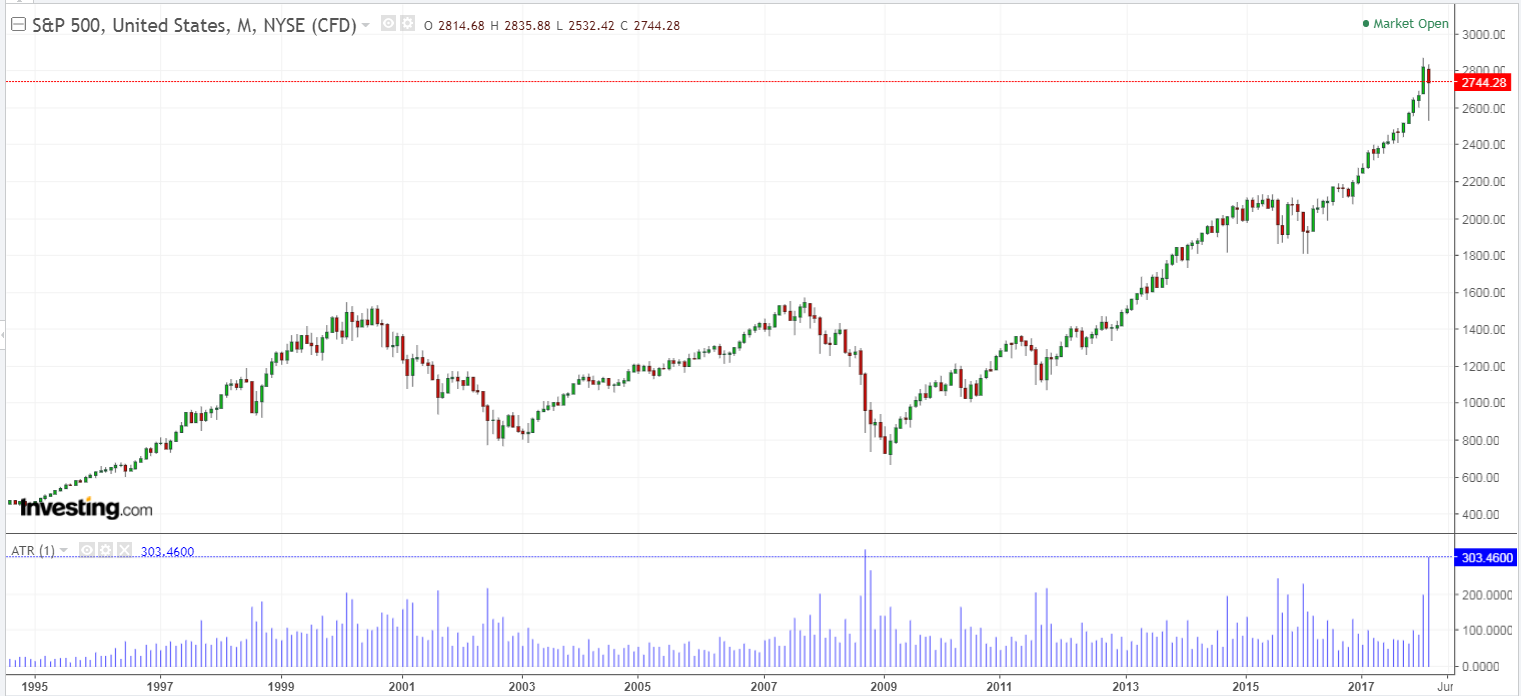
The monthly chart of the SPX below depicts the ATR indicator in histogram format (with an input length of one month). This length of one month illustrates which months made the most volatile moves during the past 20 years. Generally, the ATR spikes have preceded either a period of consolidation or a trend reversal. The spike in this month’s ATR is the second highest, with the highest formed by the October 2008 candle. We still have one day left in February’s candle, so a higher ATR is still possible (although it seems remote). In any event, this is hinting of further volatility ahead and either a period of consolidation or trend reversal.