Slope of Hope Blog Posts

Slope initially began as a blog, so this is where most of the website’s content resides. Here we have tens of thousands of posts dating back over a decade. These are listed in reverse chronological order. Click on any category icon below to see posts tagged with that particular subject, or click on a word in the category cloud on the right side of the screen for more specific choices.

SlopeCharts In Action

By -

I had a recent experience with Slopecharts that I wanted to share, since it is illustrative of how some very simple functions built into the program can produce powerful results.

I have a watch list called ETFs which contains 80 symbols of popular ETF symbols like SPY, TLT, QQQ, and so forth. Because these instruments have been so important to my trading, I wondered to myself if there were other interesting symbols that I wasn’t yet following.

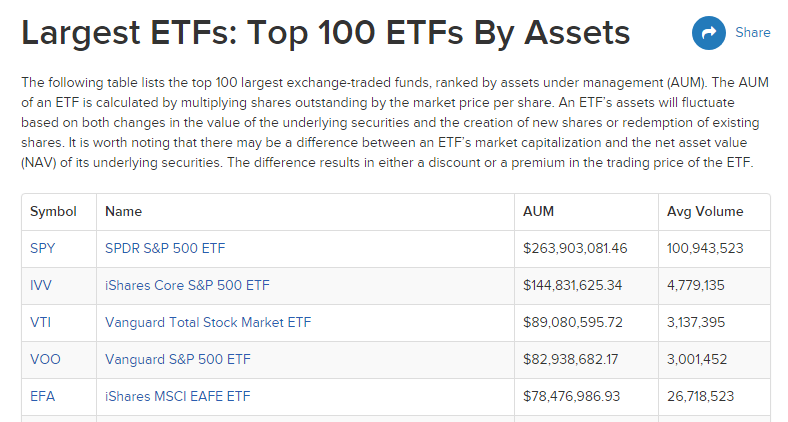
One Google search later, I was on a page that had the biggest 100 funds, and I simply copied this table text and pasted it into Excel.

s1 (more…)

Emerging Markets ETF: Cheap to Buy?

By -

The following monthly chart of the Emerging Markets ETF (EEM) shows that price has dropped below major resistance around the 50.00 level, after rallying towards its all-time high of 55.82. Near-term support is at 45.00, while major support lies below at 40.00 (the apex of a converging trendline and channel), or lower at 35.00 (historical price support).

Whether or not its current price represents fair value on this longer timeframe remains to be seen. The fact that January’s gap up has now been filled may be a warning that lower prices are ahead, before this ETF begins to stabilize and present more of a viable buying opportunity.

US Stock Market, Precious Metals and the Macro Backdrop

By -

US Stock Market

We will update global markets as well as the macro situation in NFTRH 486, but for this article I’d like to focus on the US stock market.

Let’s cut to the chase; the markets have finally fallen in line for those of us who manage markets, as opposed to dollar cost average into them through a money manager and then go about life, blissfully unaware. Much like during the 2015-2016 period, when the media were all but demanding investors go one way when the right way was the opposite (for example, we got bullish during the Brexit mini hysteria because sentiment, macro indicators and charts told us to) during the market top (that wasn’t).

But today the bliss is wearing off as the average person did not need to wait for his monthly statement to see that something went wrong with the up-melting market that was printing him money every month. Here is a look at the Google Trend for the search term “stock market crash”. Per Google’s computation method, the reading cannot go higher than 100. (more…)