Stan and I did our free monthly Chart Chat at theartofchart.net yesterday. If you missed that you can see the recording on our February Free Webinars page.
I was looking for a decline of more than 5% from the high on SPX to signal that the market was normalising into a more two way trading environment, and that has been hit today, and then some. On the video below I was noting the large amount of positive divergence on various charts and liking the odds for a rally that has not yet materialised, with SPX punching 1% below the daily lower band at the LOD so far.
This is impressive stuff, and the advances/declines level today is suggesting that we may see a repeat of Friday afternoon with a close at or near the low. Intraday Video from theartofchart.net – Update on ES, NQ and TF:
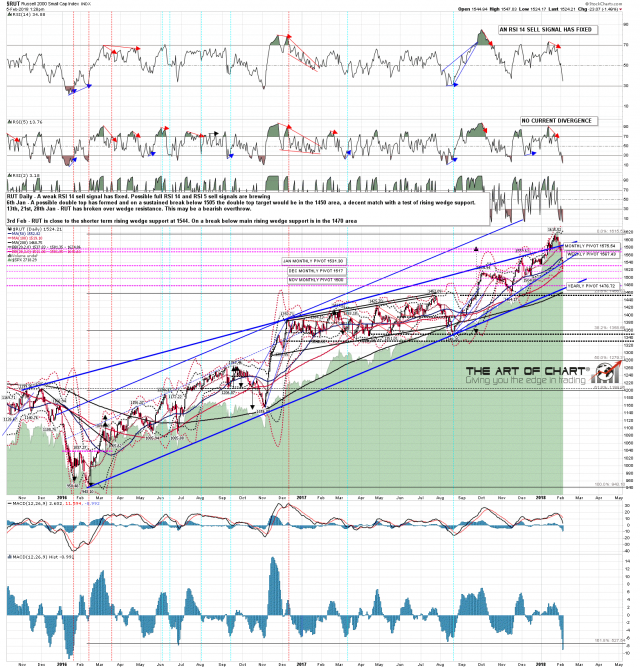
Are there lower targets that are opening up? Yes. RUT broke the first support trendline today and that opens a strong target at the next trendline support now in the 1470 area, bracketed by the yearly pivot at 1476/7 and the 200dma now at 1460. We should see a decent rally soon. After that we likely will need another leg down. RUT daily chart:


