
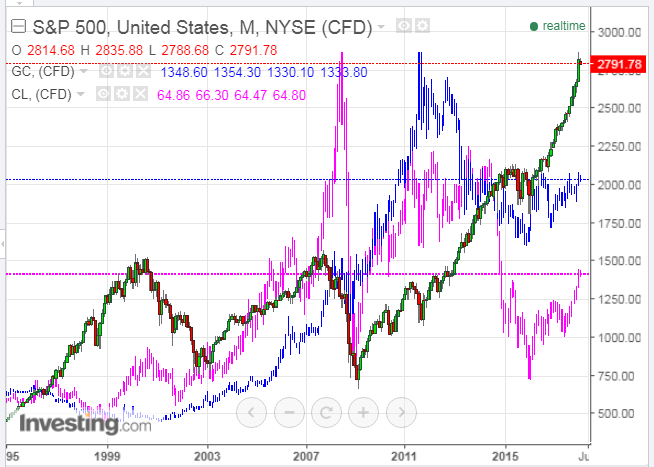
Looking back at a longer-term monthly view of the S&P 500 Index (SPX) compared with GOLD (GC) (blue bars) and WTIC Crude Oil (CL) (pink bars), we saw a broad correlation among these regarding rallies and pullbacks…until 2011 when the bounce in GC and CL stalled and, ultimately, sank in mid-2014, especially CL when it plunged to (just below) post-financial crisis levels in January of 2016.
As I write this post at 11:50am ET on Friday, we see that, while the SPX is just below all-time highs, GC faces major resistance at 1350, and CL is swirling around 65.00 (major resistance/support).
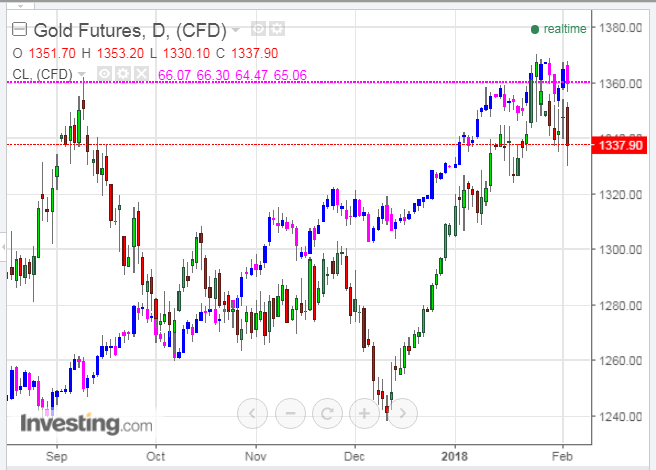
As shown on the following daily chart of GC (green & red) compared with CL (blue & pink), price in these two commodities has stalled the past couple of weeks, and is down, again, today.
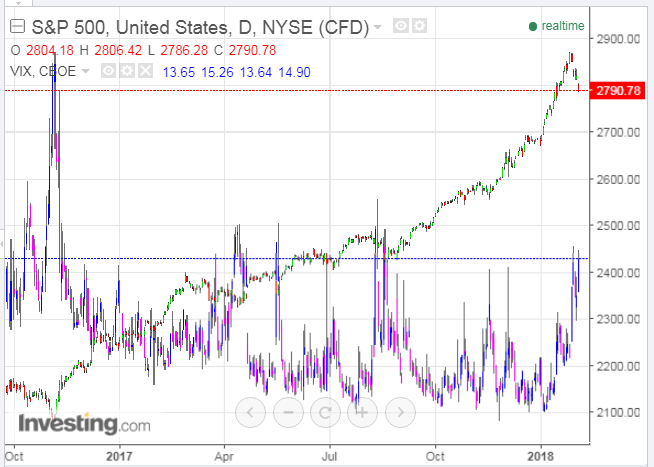
Given the “shock drop” that began in the SPX on Tuesday and which continues today, as shown on the daily chart below (with the VIX overlayed on it), if GC and CL continue to decline next week, and beyond, this could signal the beginning of a pullback in the SPX, and equities, in general.
Keep an eye on the SPX:VIX ratio as one tool that can be used to gauge such a possibility/probability, as I more fully described in my post of January 31.
As well, the details I outlined in my post of January 27 regarding CL are worth monitoring.
P.S. And, this article was just released by Bloomberg.com…

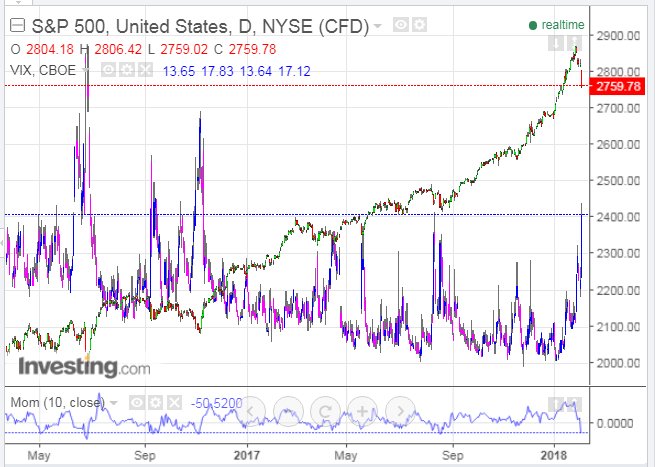
P.S. How the SPX and VIX closed today (daily chart)…
…and how GC and CL closed (daily chart)…next week should be interesting.

