Slope of Hope Blog Posts

Slope initially began as a blog, so this is where most of the website’s content resides. Here we have tens of thousands of posts dating back over a decade. These are listed in reverse chronological order. Click on any category icon below to see posts tagged with that particular subject, or click on a word in the category cloud on the right side of the screen for more specific choices.

Schrödinger’s Bacon

By -

Sometimes as I cook with my older children we take a moment to discuss the great issues of our times and, after a quick foray this afternoon into the placebo effect and alternative medicines, my son and I decided to tackle the important matter of adapting Schrodinger’s famous quantum physics experiment to fit the perspective of our labrador/poodle cross Pippa.

As Pippa’s main and possibly only interest is in food, we decided to replace the cat with bacon, which would be placed in the same locked box with an atomic clock that, at the key random point of atomic decay, would now trigger a process that would perfectly grill the bacon. The bacon would therefore exist in a quantum probability cloud state of cooked/uncooked until the moment that the state was crystallised by Pippa’s observation of the bacon, obviously through smell rather than sight. (more…)

Mixed Bag of Tricks

By -

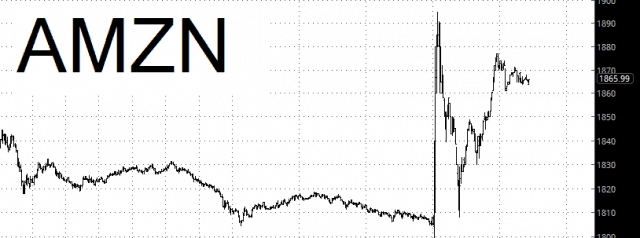
After the absolutely unchecked pandemonium of Facebook over the past 24 hours, the world was on the edge of its seat with today’s featured presentation, which was the Amazon earnings report. After all the FB madness, AMZN turned out to be a relative bore. I mean, it’s UP and everything, but as I am typing this, it’s only 0.5% higher than its high yesterday. So – – not exactly setting the world on fire.

AMZND (more…)

The Dividend Difference

By -

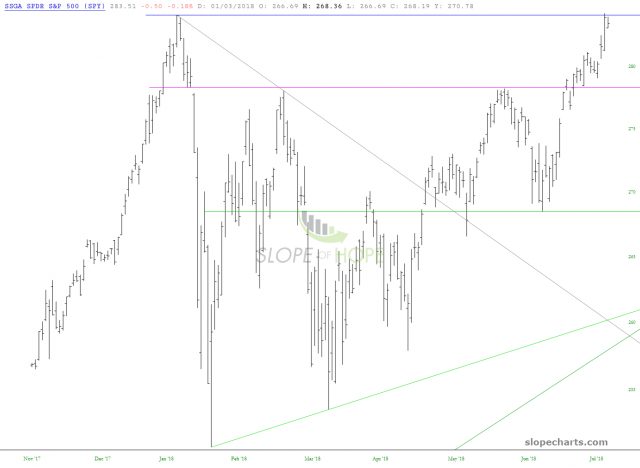
I wanted to mention a subtlety in SlopeCharts that comes up more than any other, and that is about dividends. Our data is adjusted for splits and dividends, as I believe it should be. As an example, here is the chart of SPY, which looks poised for (God forgive me) an explosive breakout higher. It looks “different” than any other chart, because, well, their data is inferior.

slopechart SPY (more…)