
Seasonality part two appears ready to ignite oil bulls as the March contract futures options come to an end, and two key drivers are leading the charge.
Thursday at settlement (2:30 p.m. EST) will see oil’s March contract options vanish to expiration heaven … or hell if you’ve been trying to trend trade /cl with the bullish seasonality that oil has historically seen when the roll to the February contract options starts.

Yeah, the March contract has been a choppy mess. It even gave bulls a false start on the daily chart for an inverted head and shoulders pattern when price action on February 1st broke and closed above the 54.55 neckline. You know the tale since: price when an entire NINE CENTS above that high of that Feb. 1st candle, then promptly reversed beneath.
However, the chop we saw created a higher right shoulder, altering the probabilities of the pattern in favor of bulls.

Taking a conservative view of potential targets from the pattern, a 61.8% projection of the 42.36 low to the lower left shoulder high (54.55) on the continuous contract chart gives us 62.11 as a first target.
Going for a 1-to-1 target of the pattern would take price up to 66.79, and in the middle of a prior untested consolidation zone on the daily chart. As three of my mentors stress: Look left, structure leaves clues.
So what about those two keys drivers I mentioned above?
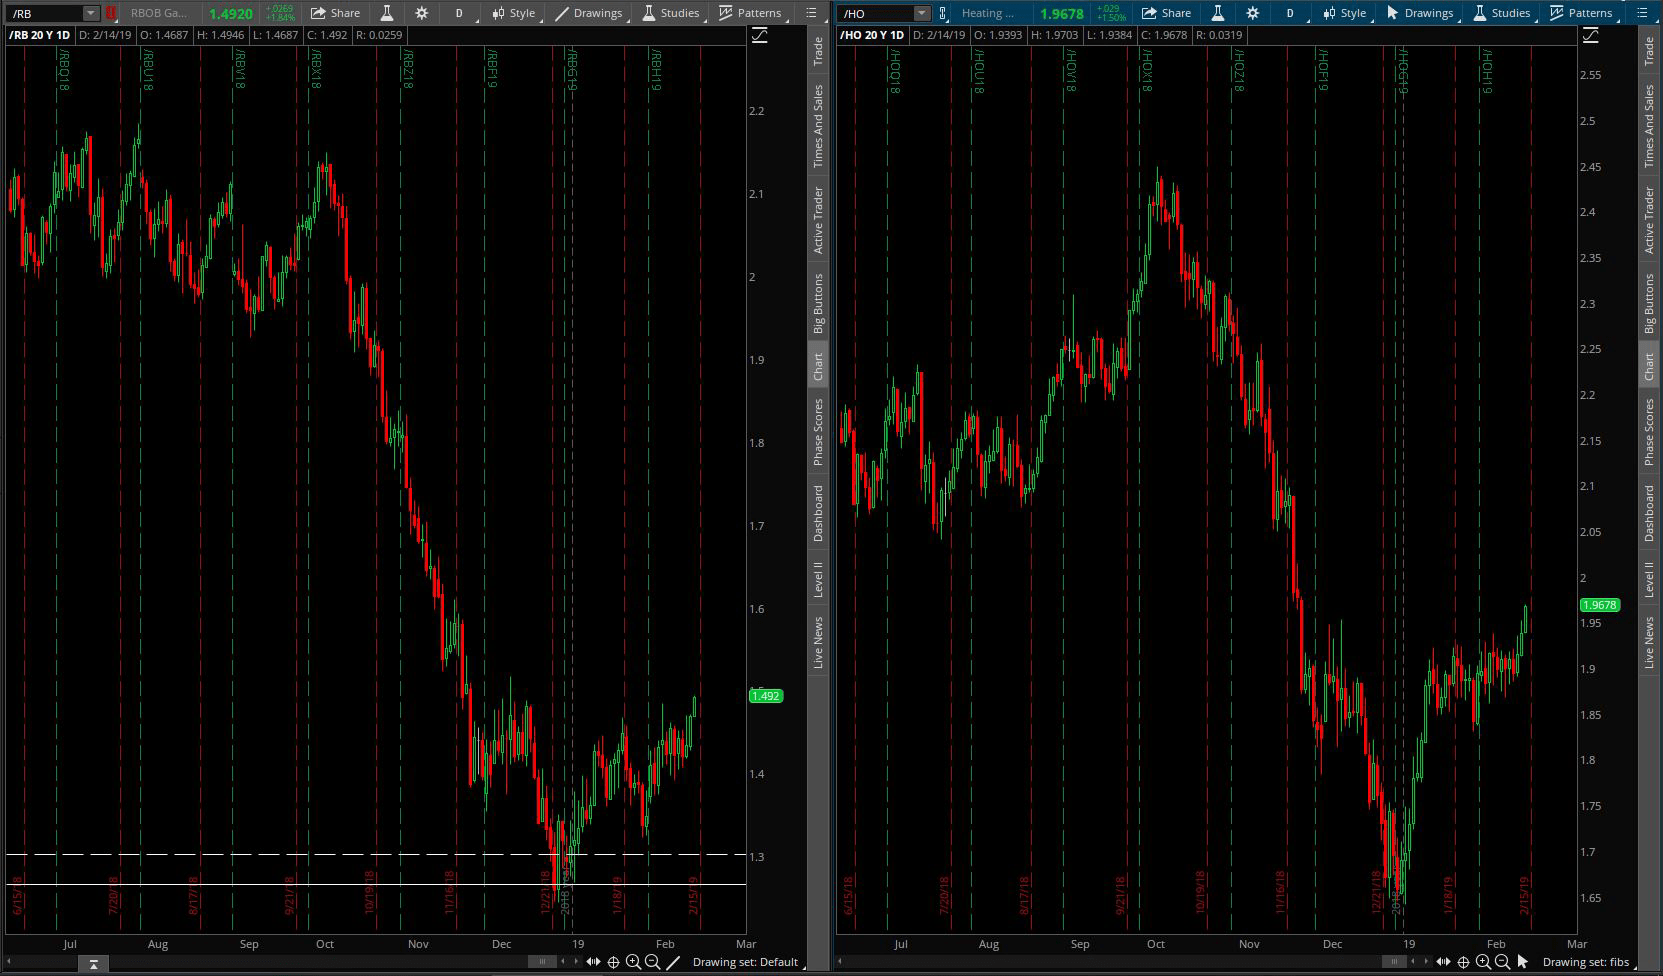
Those would be gasoline and heating oil futures. Note the increasing bullish momentum with half-a-month left in their March contracts.
This is likely due to larger traders anticipating the traditional April contract pop. That month signifies the switch to “summer blend” EPA requirements which make gas and diesel more expensive.
Which brings us to the crack spread.
You may have heard of this before, but not have paid attention to it if you’re not an oil trader.
The term refers to the relationship between the price for a barrel of oil versus it’s refined products.
Here’s a quick breakdown from the U.S. EIA:
“On average, U.S. refineries produce, from a 42-gallon barrel of crude oil, about 20 to 19 gallons of motor gasoline, 12 gallons of distillate fuel distillate fuel, most of which is sold as diesel fuel, and 4 gallons of jet fuel. More than a dozen other petroleum products are also produced in refineries. Petroleum refineries produce liquids the petrochemical industry uses to make a variety of chemicals and plastics.”
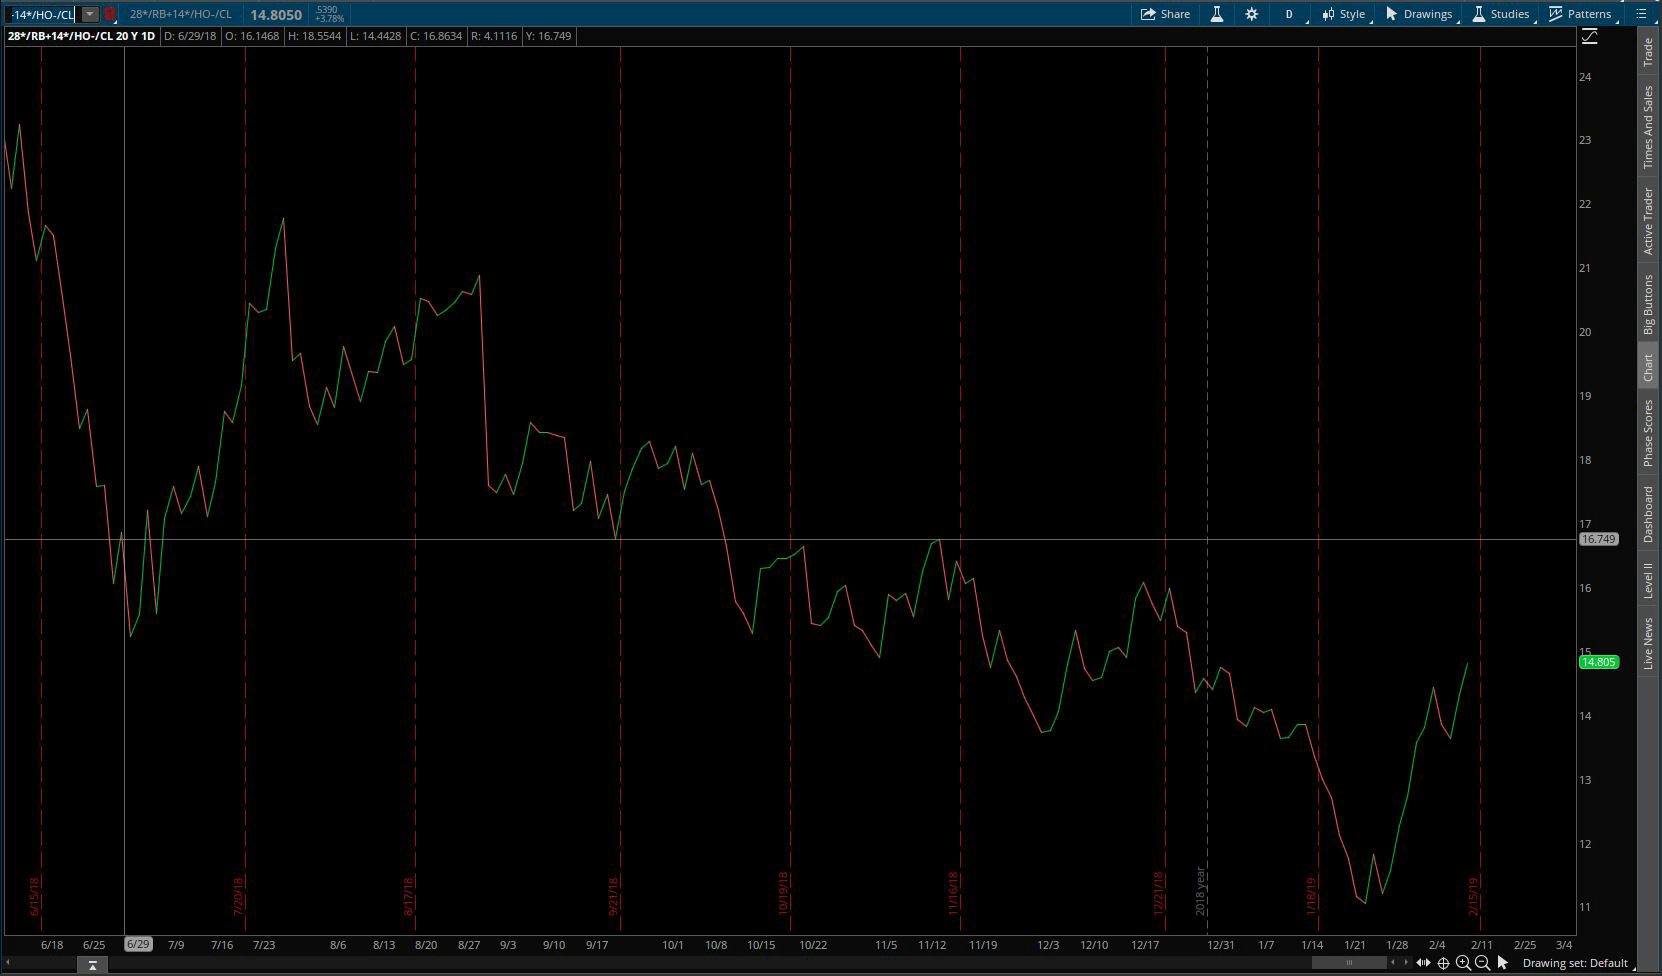
For trading purposes: One /cl contract roughly equals one /rb + two /ho contracts. That relationship is shown in the chart above. For a bit more on trading the crack spread, see this link from a prior Tastytrade episode.
If you multiply it out, here’s the formula you want to enter if using thinkorswim:
28/RB+14/HO-/CL
What the crack spread chart tells us is that the refined products have recently made a higher high, which means that refiners are making greater profits. It also indicates that demand is rising.
Historically, when the crack spread is rising it’s bullish for the overall oil complex.
If you don’t trade futures, forget those horrible ETN products $USO and $UGA if you want to consider a trade. Instead look to companies like $HES and $VLO.
$HES is the highest correlated non-futures stock option for traders who want to speculate on oil’s direction (and yes it has options!).
$VLO offers a good mix of both liquid stock/options with actual price movement (Have you seen a chart of of Exxon ($XOM) or Chevron ($CVX)? Big boats turn slow).
