Slope of Hope Blog Posts
Slope initially began as a blog, so this is where most of the website’s content resides. Here we have tens of thousands of posts dating back over a decade. These are listed in reverse chronological order. Click on any category icon below to see posts tagged with that particular subject, or click on a word in the category cloud on the right side of the screen for more specific choices.
It Sounds Wild But …………….
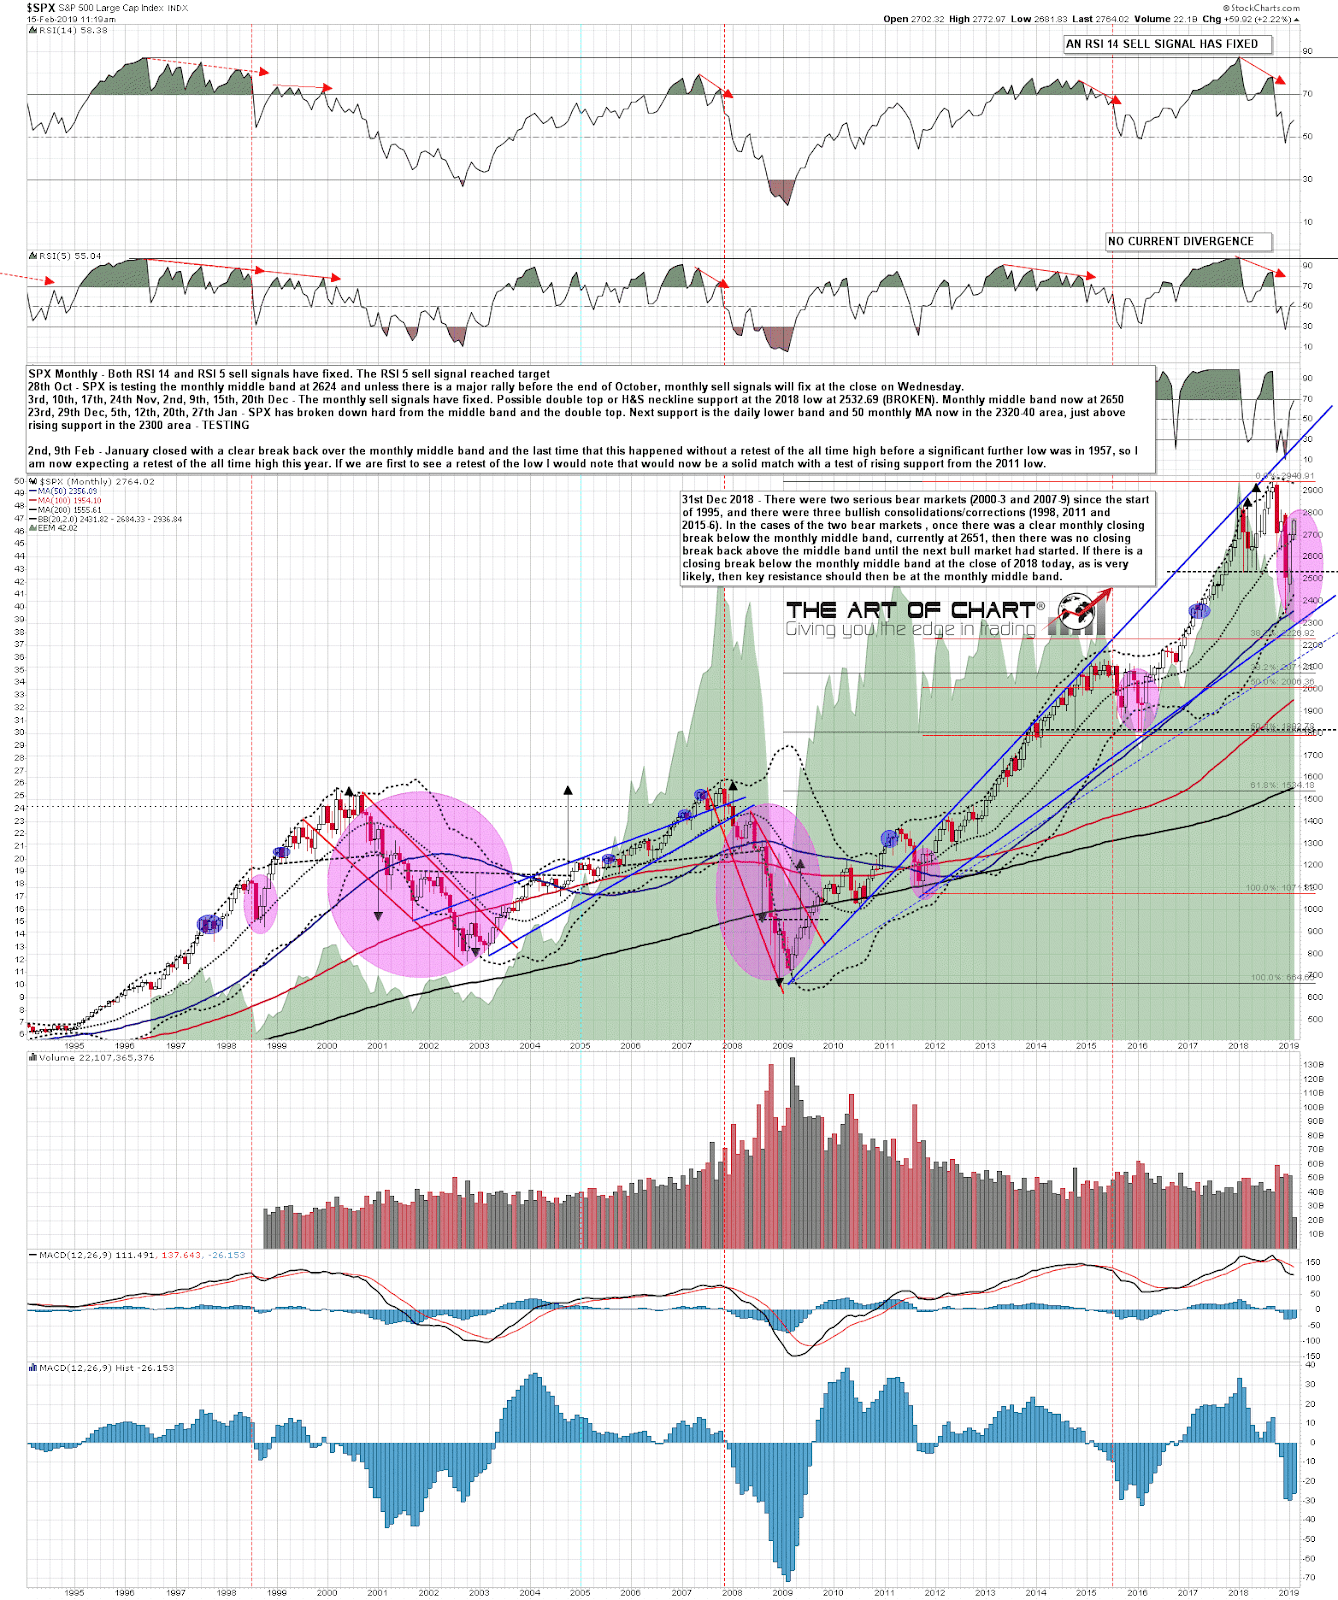
At the end of December I posted the SPX monthly chart for subscribers at theartofchart.net talking about the significance of the monthly middle band in bear market moves. I posted the chart on a post here on 24th January when it had become clear that such a close back above was possible, and we saw that close back above at the end of January. What I said in the notes on the chart below was that in the event that we were to see a clear monthly close back above the monthly middle band, then the last time that such a close failed to deliver a retest of the all time high before a significant lower low (under 2346) was in 1957. Obviously I am therefore now seriously considering the possibility that SPX may be on the way to a retest of the all time high, and given the overall setup that might well then be the second high of a major double top.
SPX monthly chart:
Friday Night Libations

Improvements Recap
So much has been happening on Slope lately, it’s easy to lose track. I’ve been rearranging and polishing the menus and navigation of the site to try to make things more “exposed” and obvious, but I wanted to highlight three particular items, each of which is hyperlinked to its page:
- Sector Performance – This page offers about a dozen different views into relative sector performance, including real-time data to show what’s happening on the current trading day;
- Big Movers – This shows the present day’s big “up” and “down” equities;
- SlopeRules – Over the past couple of weeks, there have been about a dozen improvements, the most important of which is illustrated with this video (and, within the next 24 hours, we’ll be rolling out MACD rules)
This is an iterative process. I create stuff. You try it out. You write to me and tell me what you’d like improved. Then I go back to work. This is how we make things better, and have done so for 14 years strong now.
Excellent Case Study
What I’m really enjoying about SlopeRules is that every time I use it, I think of at least one important new feature to add. See, with SlopeCharts, for me, it’s basically perfect. I use it dozens of hours every week, and – – like I say – – it’s absolutely perfect. There’s nothing else I want it to do.
SlopeRules, on the other hand, is a newborn baby, and there’s all kinds of things I want to teach it.
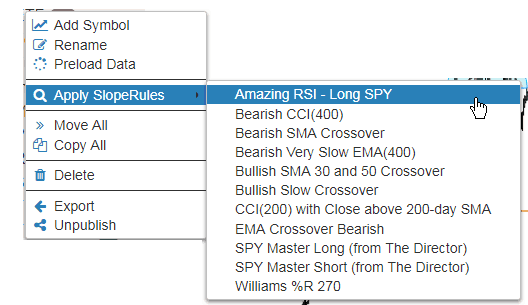
I decided to have a little fun and try to tease out what SlopeRules set seemed to work well with my ETF list. So I right-clicked on my ETF watchlist (which has 60 symbols) and went to Apply SlopeRules, one by one: