
Everything going slow today as I’m really not feeling 100%.
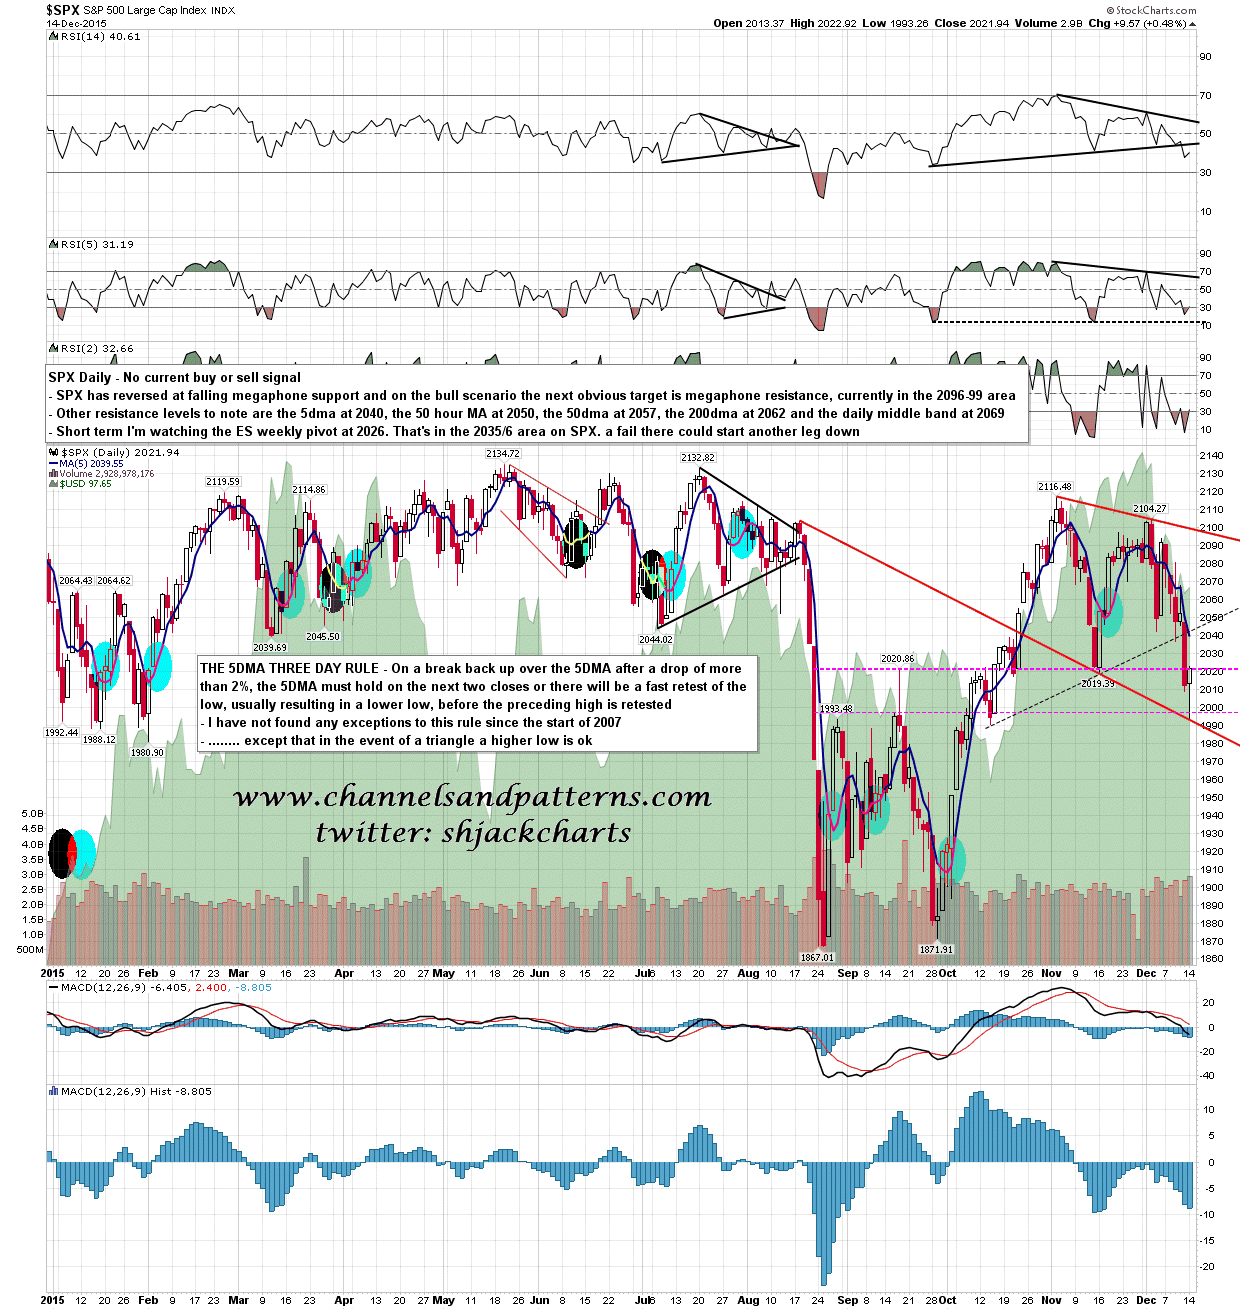
SPX went slightly below my 1997/8 target and established a slightly lower falling megaphone support trendline at 1993. On my main scenario that has been playing out very nicely so far, the next target within the megaphone in megaphone resistance in the 2096-9 area. We’ll see. The important resistance levels today are marked on the chart below. SPX daily chart:
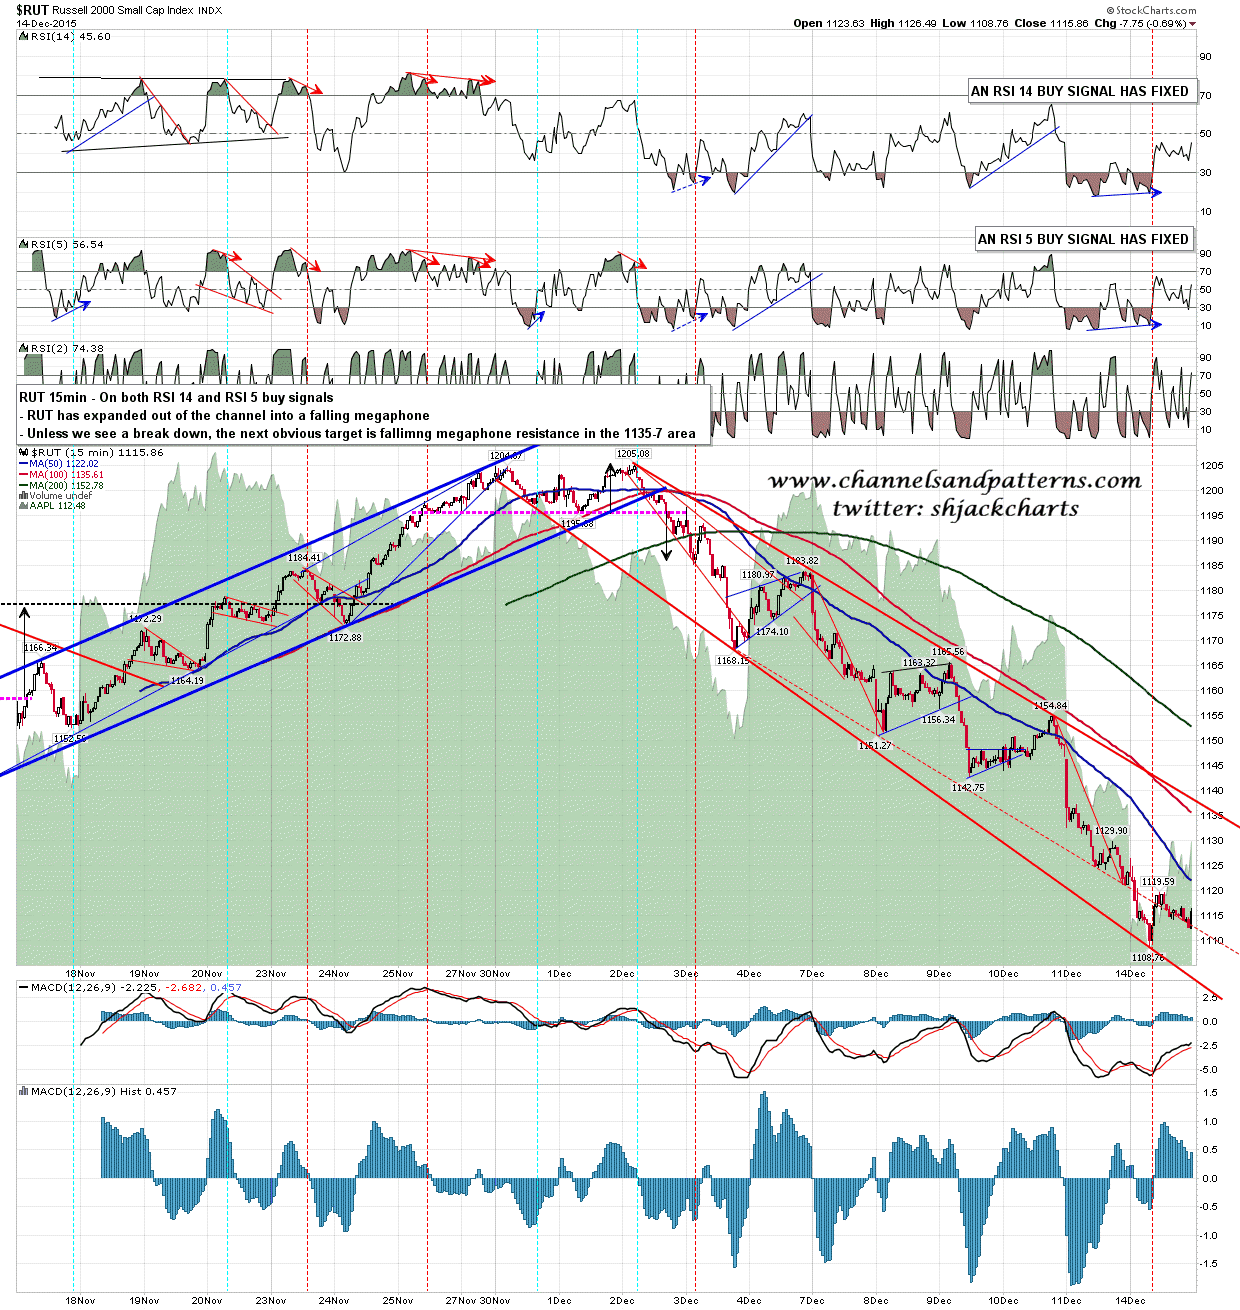
RUT broke down slightly from the falling channel into a falling megaphone. The next obvious target within the megaphone is megaphone resistance in the 1135-7 area. RUT 15min chart:
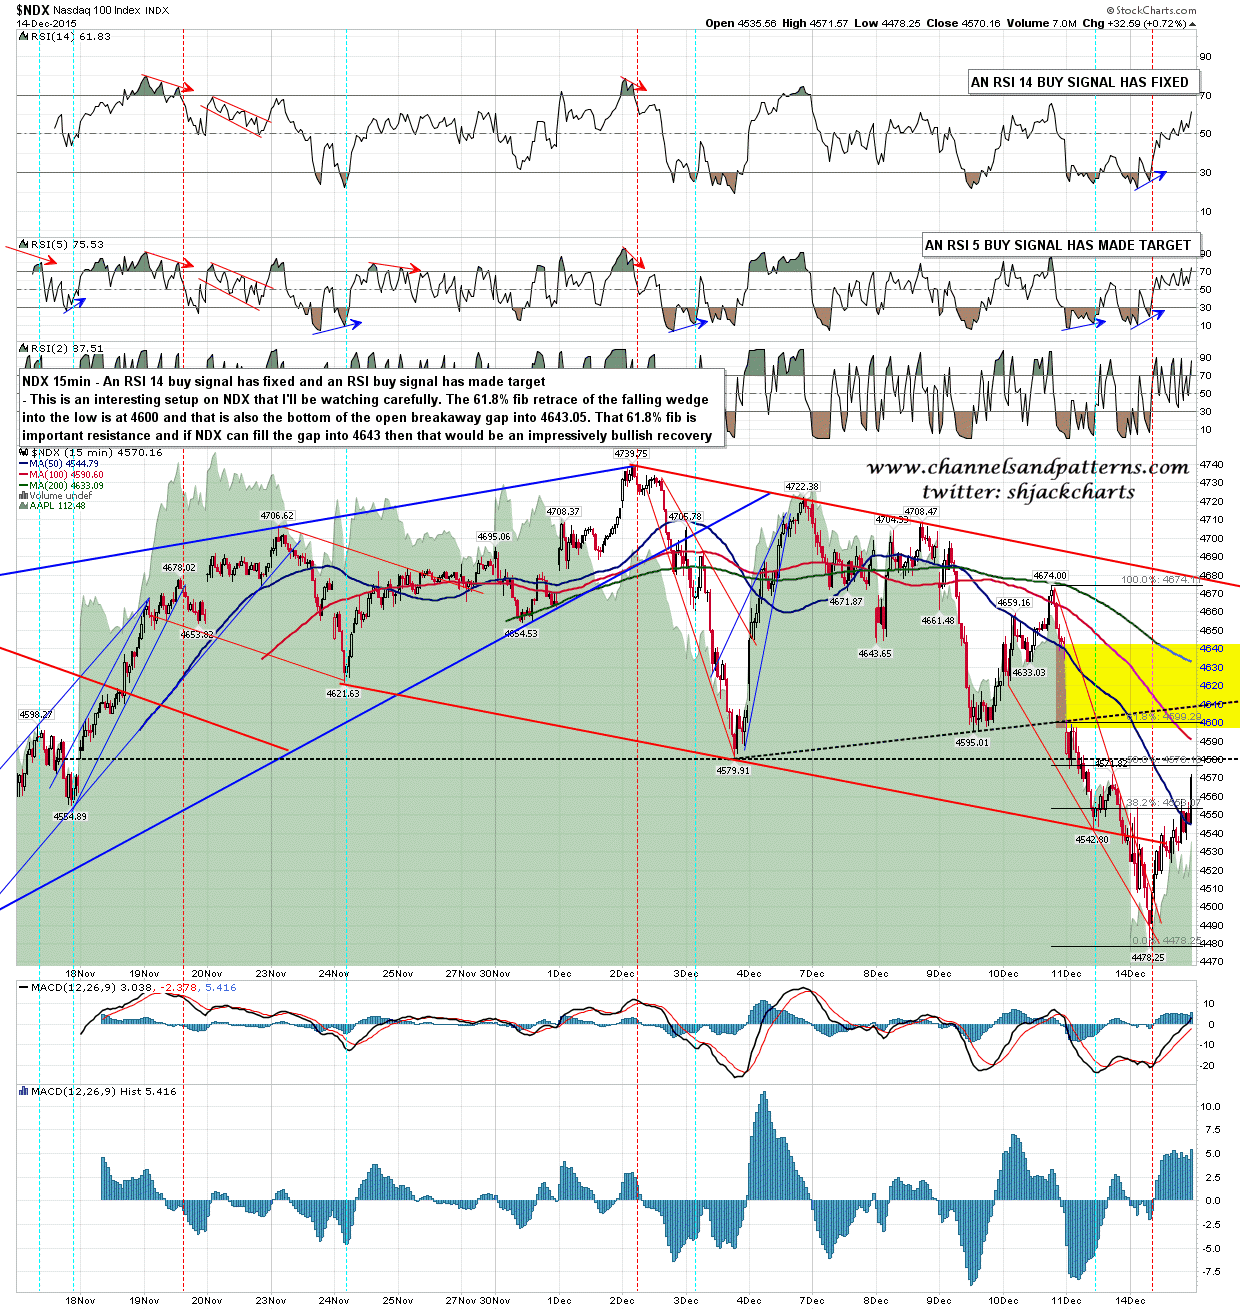
NDX broke the falling channel and slightly broke the big double top support, and then reversed hard. NDX is well over the 61.8% fib retracement and getting close to filling the big breakaway gap into 4643.05. That would be impressively bullish. NDX 15min chart:
All three indices have strong 15min RSI 14 buy signals and both SPX and NDX have made target on those, with RUT slightly short. My preferred scenario has today most likely being a trend day and the next target at the full triangle retrace at 2067 on the way back to megaphone resistance just under 2100. Today is a cycle trend day so we’ll see how that goes. If we are going to see a fail into another leg down, then my eye will be on the SPX 50 hour MA at 2051 (tested at the time of writing), the 50dma at 2059, the 200dma at 2062 and the daily mid band at 2069.
Just a reminder that Stan and I are doing a special free to all Chart Chat at theartofchart.net on Thursday after the close with our projections for next year and reviewing our calls from the one we did a year ago to see how we did. You can sign up for that here and spaces are limited so if you are coming, you should sign up sooner rather than later.
