
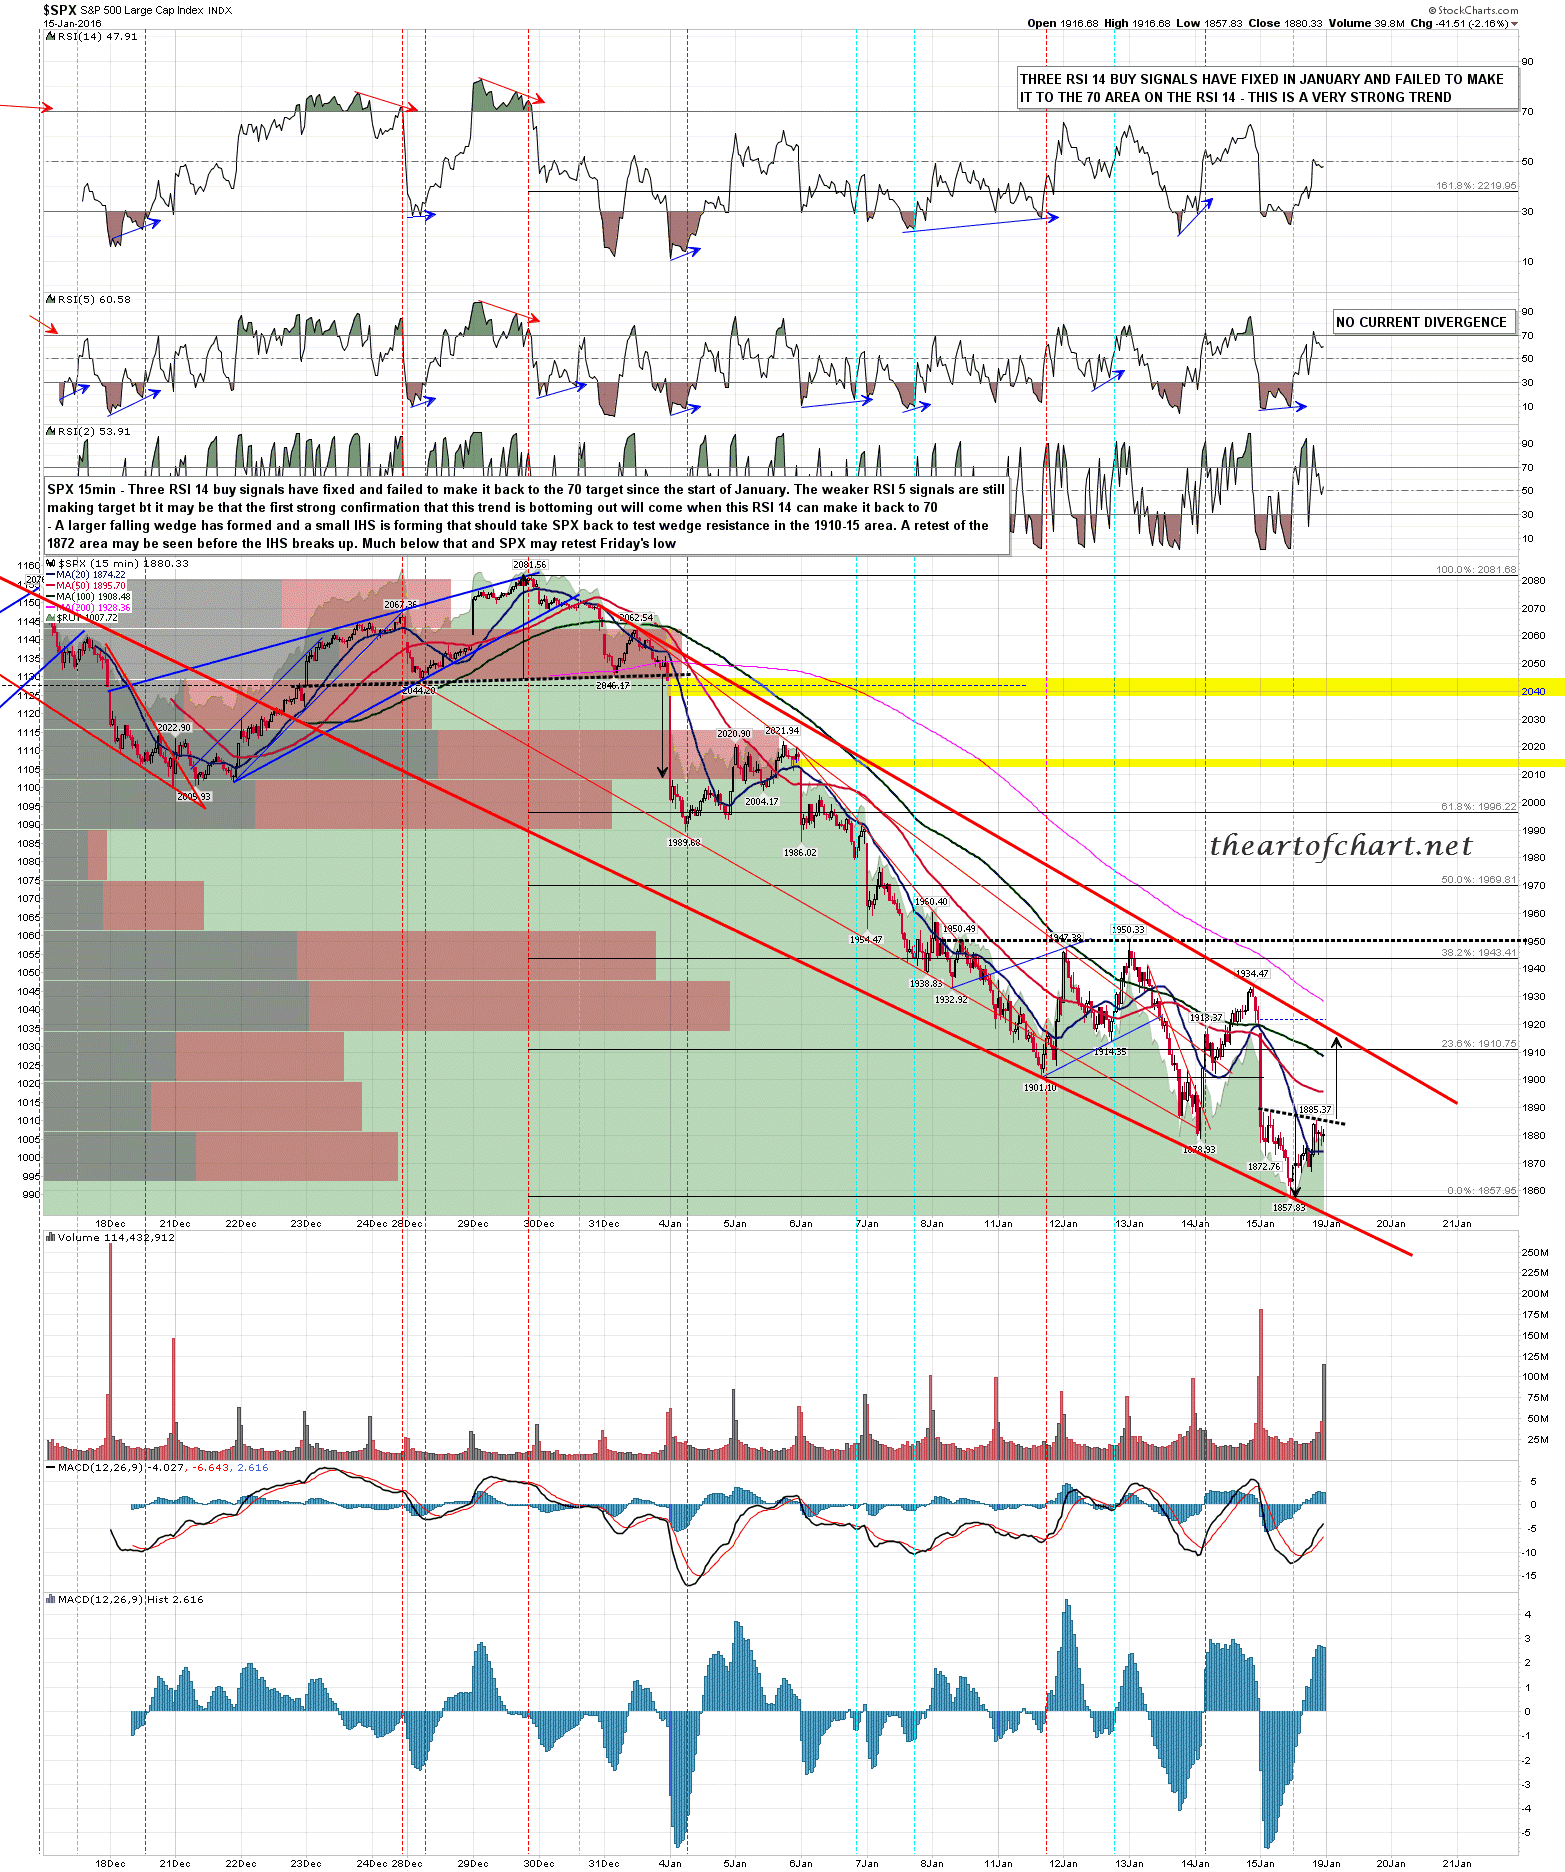
There’s been a very decent rally yesterday, and the obvious target on the SPX 15min chart is a hit of wedge resistance in the 1910-5 this morning. I prepared the chart below on Sunday for theartofchart.net chart service subscribers so you can see that so far at least, this rally is pretty much as expected. SPX 15min chart:
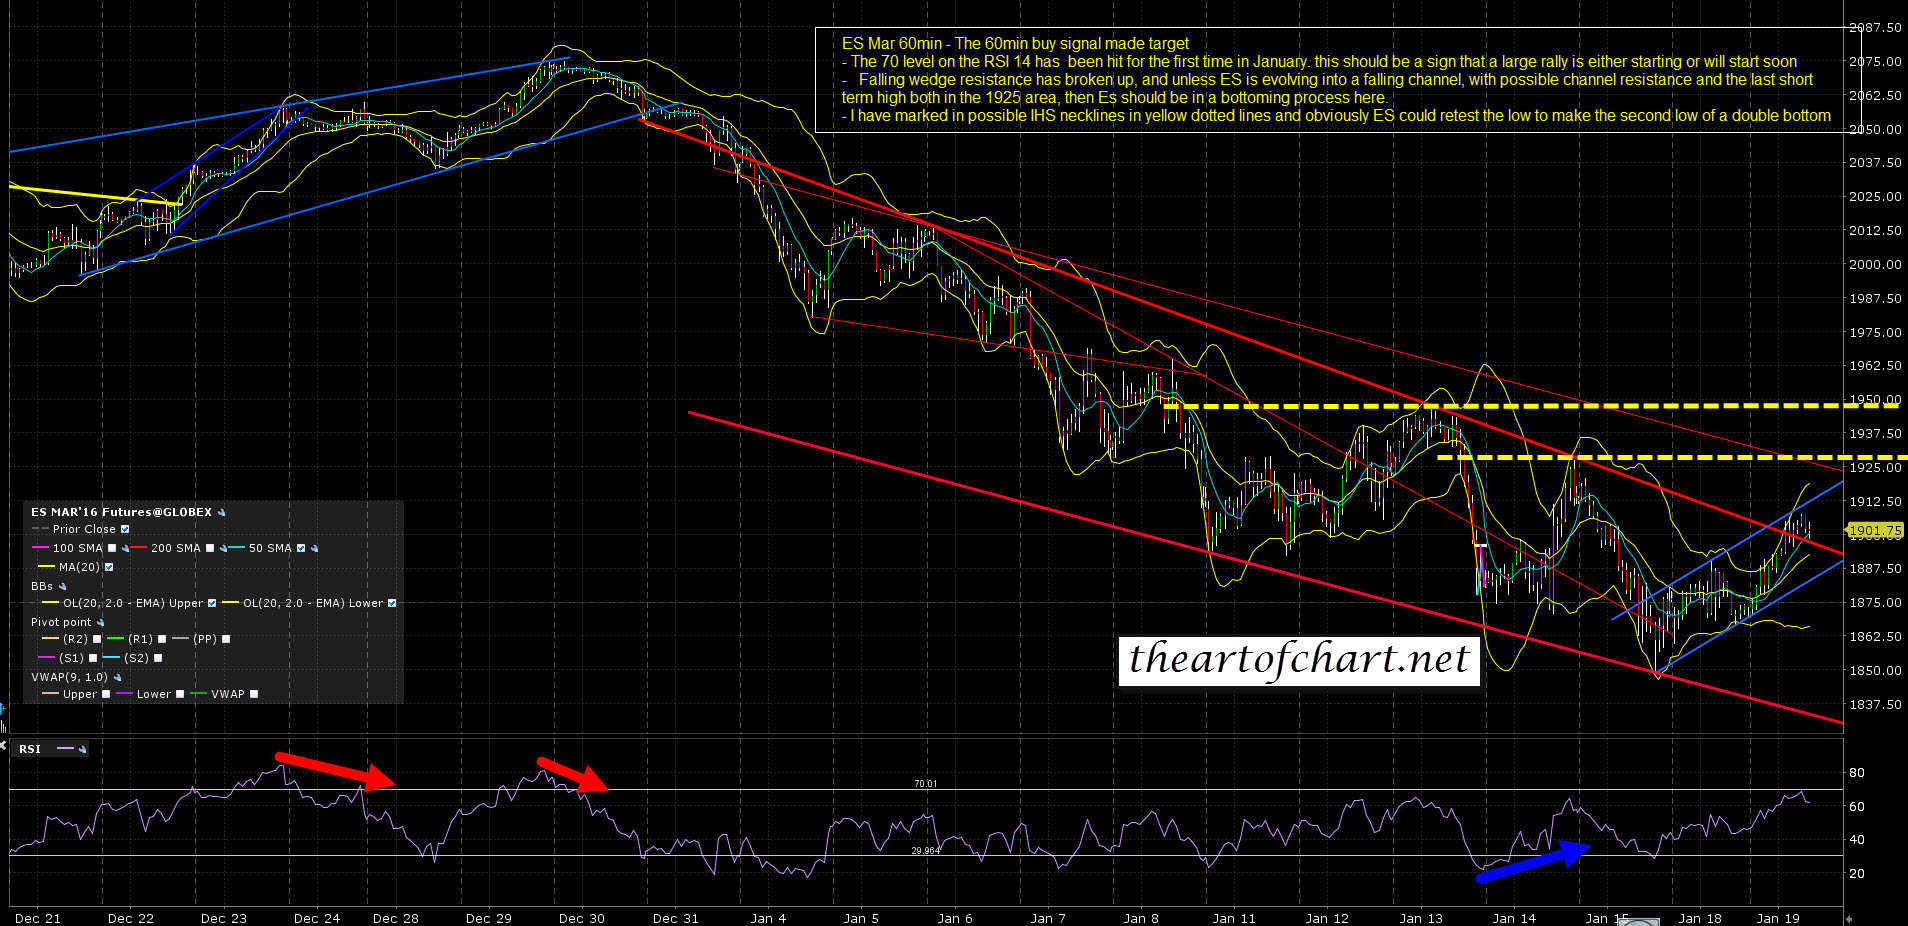
What’s more interesting is that the falling wedge on ES has broken up overnight. If we see the same happen on SPX, and possibly if we don’t, this should mean that ES/SPX are in a bottoming process. We’ll see. ES 60min chart:
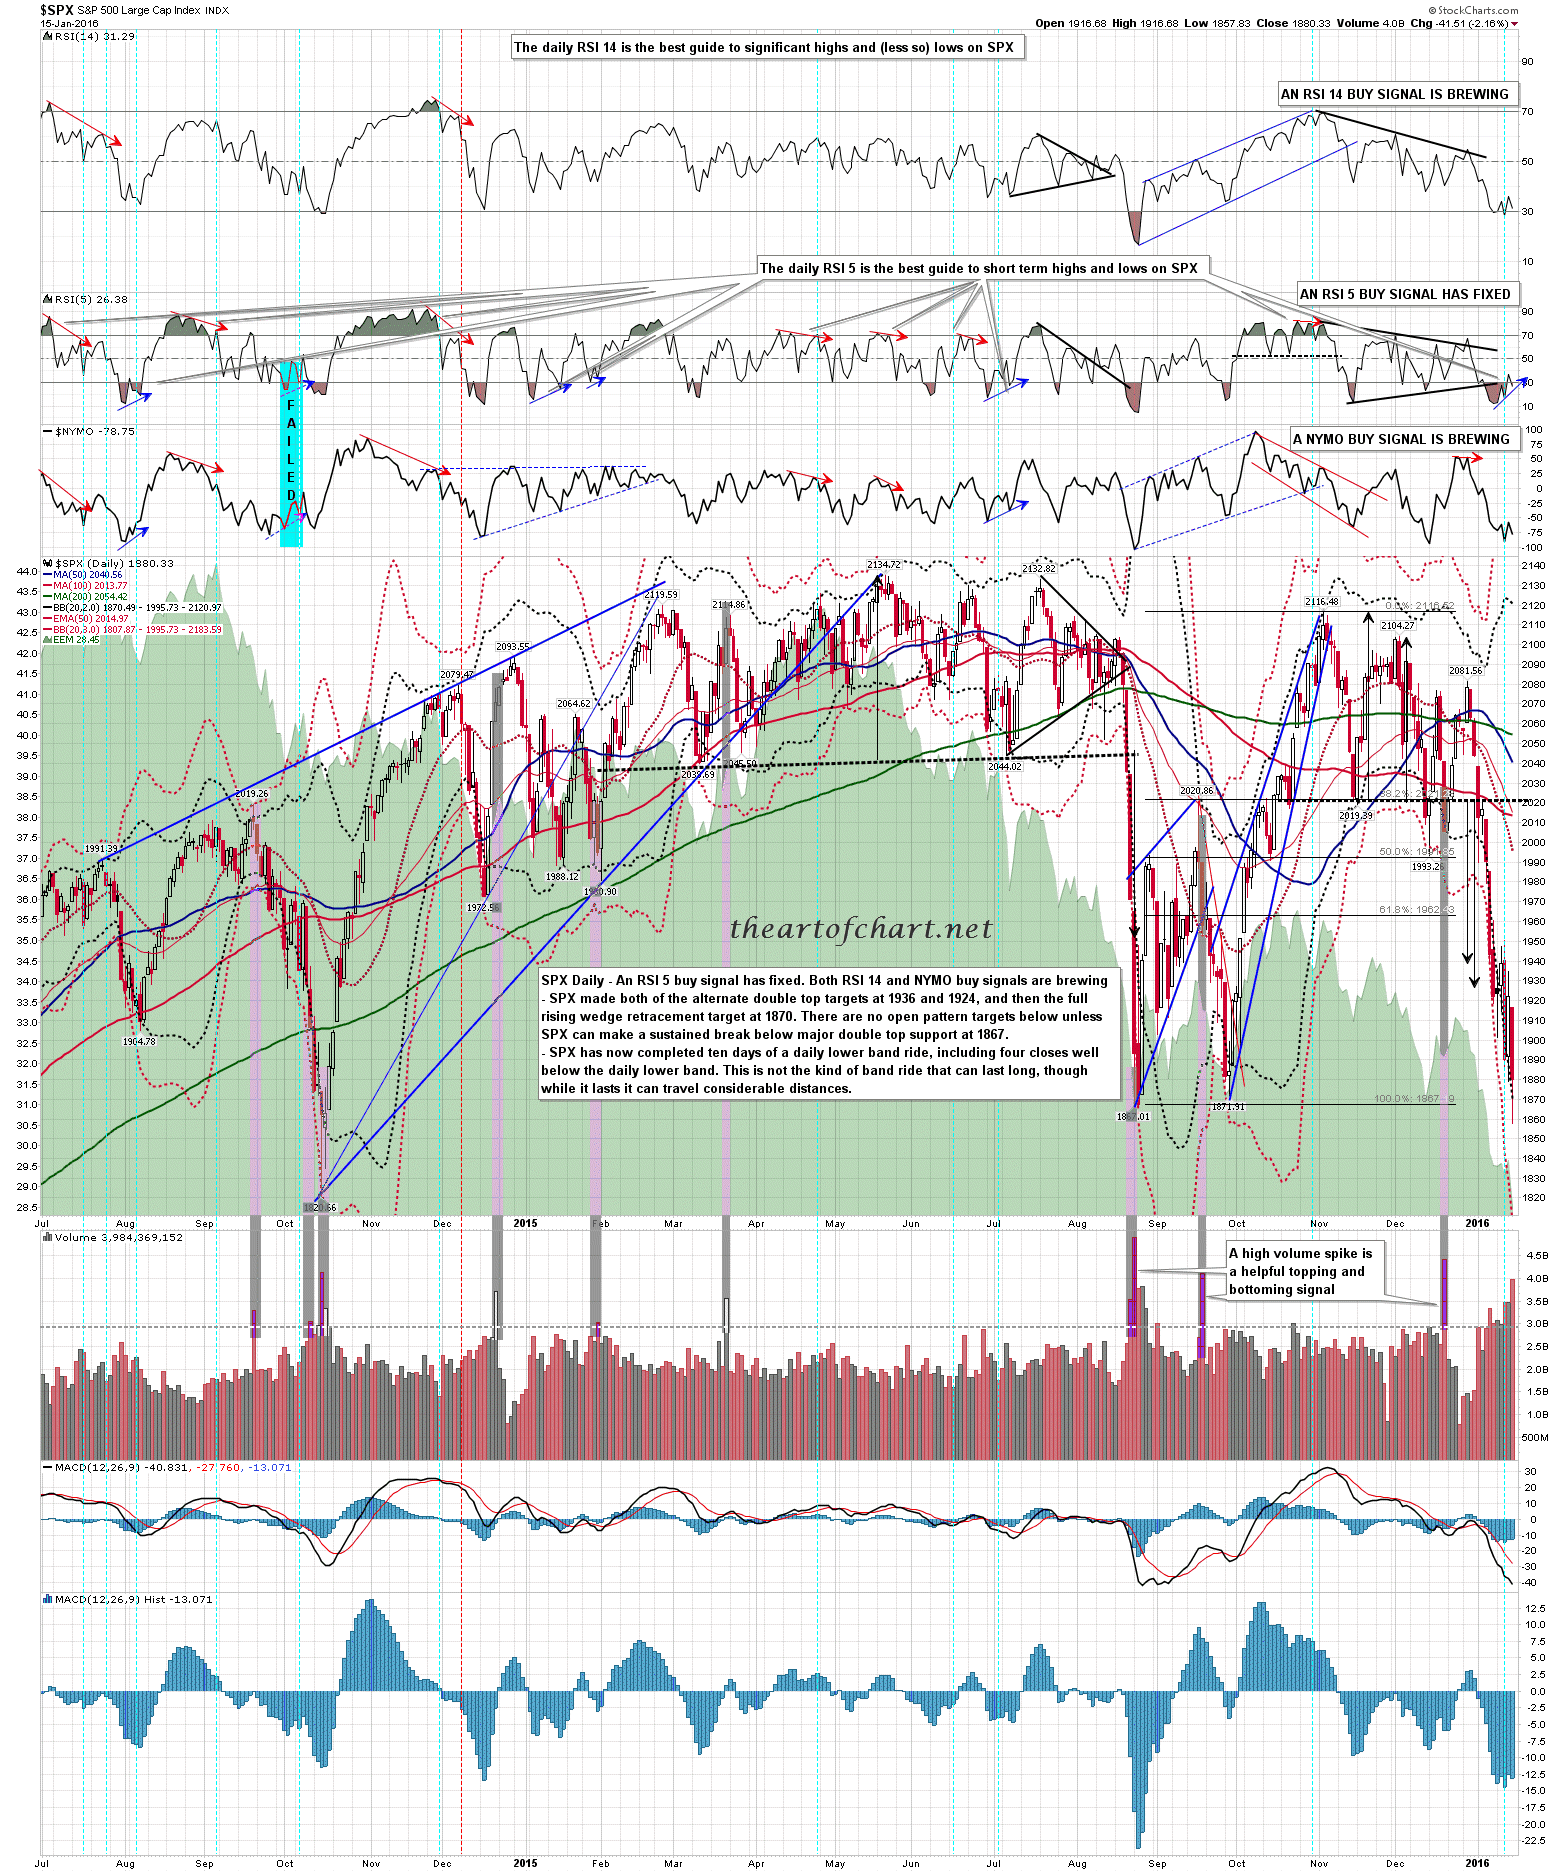
On the SPX chart there is a fixed RSI 15 buy signal, and both a weak RSI 14 buy signal and a NYMO buy signal are brewing. If the bulls can put in a strong day into the close then that might deliver a strong RSI 5_NYMO buy signal. These are definitely less reliable in strong downtrends though. One of these fixed the day before the 140 handle last leg down into the October 2014 low, so I’d suggest not mortgaging the farm to go long if it fixes. SPX daily chart:
Today is a cycle trend day, which means of course that we could see a trend day, but regardless of that there are 70% odds that the market will be dominated by either buyers or sellers. It’s becoming harder to see the dominant side being the bulls with this strong decline from the open but we’ll see. There is possible strong support at Friday’s low at 1857, and wedge support at 1910-5 is an open target above.
