
Message Received
Last month, in a post about Portfolio Armor‘s security selection method (A Security Selection Method That Beats The Market), I might have included a few too many charts. At least, that’s the impression you gave in the comments. So this time, I’ve decided to use a table instead, where every starting date links to an interactive chart.
What Am I Talking About Again?
Using price history and option market sentiment to pick securities likely to do well over the next 6 months. These securities are all hedgeable against declines as small as 9% if you want to hedge your bets with them.
Less Talk, More Numbers
Here you go.
| Starting Date | Portfolio Armor 6-Month Performance | SPY 6-Month Performance |
|---|---|---|
| June 8, 2017 | 14.49% | 9.99% |
| June 15, 2017 | 19.85% | 10.97% |
| June 22, 2017 | 24.45% | 11.27% |
| June 29, 2017 | 18.24% | 11.68% |
| July 6, 2017 | 21.03% | 14.81% |
| July 13, 2017 | 28.25% | 14.85% |
| July 20, 2017 | 25.04% | 14.62% |
| July 27, 2017 | 33.52% | 17.10% |
| August 3, 2017 | 20.72% | 12.66% |
| August 10, 2017 | 13.05% | 8.36% |
| August 17, 2017 | 10.71% | 13.48% |
| August 24, 2017 | 15.23% | 13.72% |
| August 31, 2017 | 8.42% | 10.87% |
| September 7, 2017 | 12.75% | 11.61% |
| September 14, 2017 | 29.05% | 11.19% |
| September 21, 2017 | 22.56% | 8.99% |
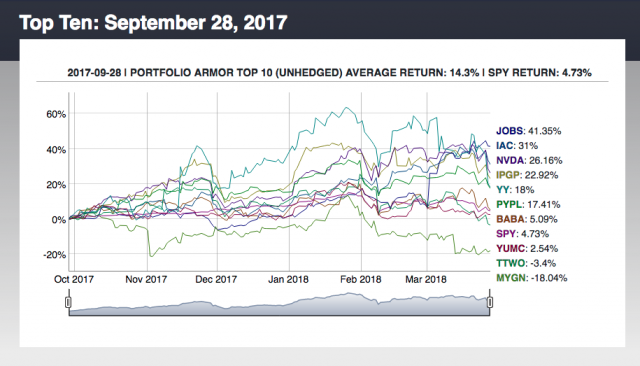
| September 28, 2017 | 14.30% | 4.73% |
| Average | 19.51% | 11.82% |
So Portfolio Armor’s top ten names averaged 19.51% over the average of these 17 6-month periods, versus SPY’s average of 11.82%, an average outperformance of 7.69% over 6 months.
That table gets updated every Thursday. You can find it here.
For a few months starting at the end of September, I time-stamped some of those top names each week on Twitter. I’ve collected them in a thread on Twitter, along with their results 6 months later. To see, just click on the tweet below and scroll down.
Wishing a Happy Easter and Passover to the Slope community this weekend.
A quick thread on security selection & returns. May be of interest to @AndySwan @aaronklein @jposhaughnessy @MebFaber @StockCats @JacobWolinsky @SonOfUhGunn @Greenbackd @EmanuelDerman @albertwenger
— David Pinsen (@dpinsen) March 25, 2018
