Slope of Hope Blog Posts

Slope initially began as a blog, so this is where most of the website’s content resides. Here we have tens of thousands of posts dating back over a decade. These are listed in reverse chronological order. Click on any category icon below to see posts tagged with that particular subject, or click on a word in the category cloud on the right side of the screen for more specific choices.

Overwrought

By -

There have been many posts about Overstock (OSTK) here on Slope – you can see the old ones here – but I wanted to add another one to the pile.

The head and shoulders pattern on the company is fantastic. Indeed, by traditional measured moves, the target price for OSTK is a negative number. So let’s just assume that, as battered as it already is (more than half the value destroyed already), it still has a ways to go.

OSTK (more…)

Bouncing Toward the Gap and MA

By -

As you might guess, today (Monday) was pretty much the opposite of last Friday for me. Friday was awesome. Today sucked. But as a swing trader, I’m not going to cover all my positions willy-nilly. As I so often say, the individual stops need to take care of themselves. As such, I’ve retreated from 71 positions down to 61. Of those, 51 remain profitable, and the other 10 have small losses. Average of the winners is 3.27%, and the average of the losers is negative 0.26%.

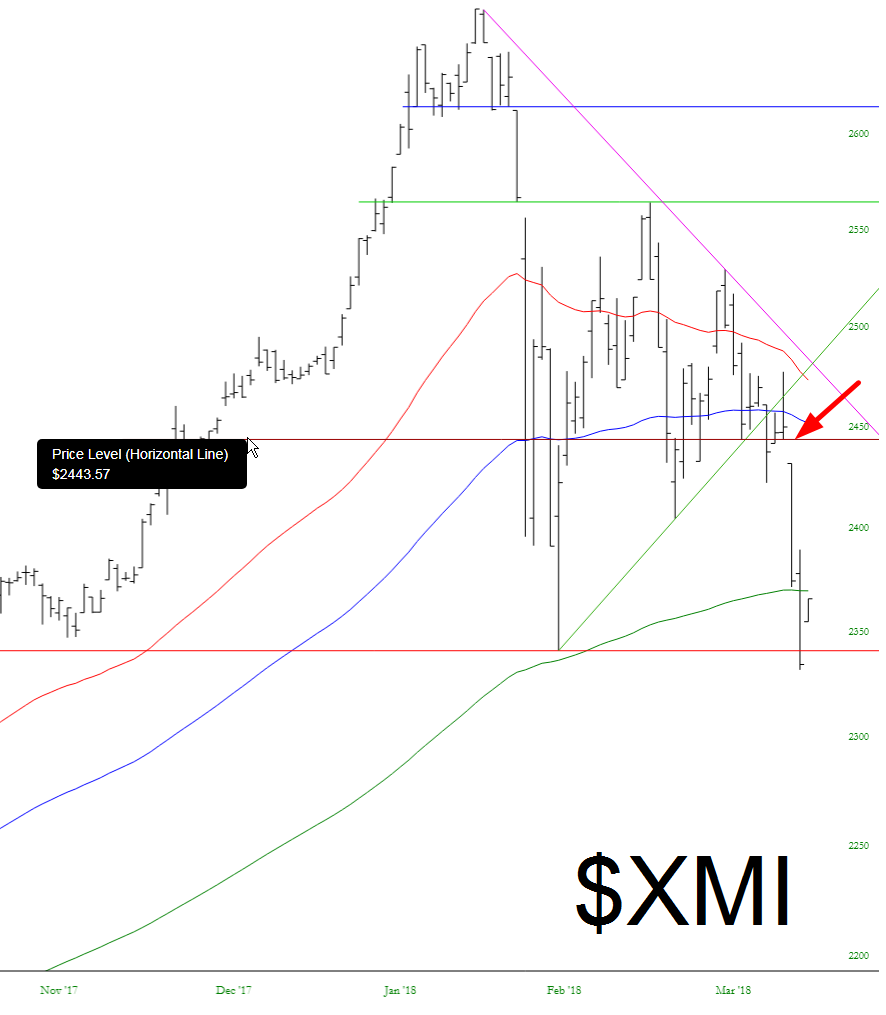
This bounce could have more life to it (and, for me, more pain). Looking at the charts, it seems to be the key is the gap between last Wednesday and Thursday. Take a look below, and you’ll see an interesting correlation between the 100 day moving average and the Wed/Thurs price gap. It seems to me, that makes a sensible bounce target. (Side note: I took this snapshots about an hour before the close, so the price moves were even higher).

xmi (more…)

Time To Buy Gold As A ‘Safe Haven’

By -

From Avi Gilburt: For those that follow me regularly, you will know that I have been tracking a set up for the GLD as a proxy for gold. I believe that the GLD can outperform the general equity market once we confirm a long term break out has begun, and I still think we can see it in occur in 2018. This week, I will provide an update to the GLD. While I have gone on record as to why I do not think the GLD is a wise long-term investment hold, I will still use it to track the market movements.

I want to start this write-up to dispel the notion of the metals being a “safe haven,” as many in the media are now parroting. I have discussed this topic many times in the years I have been writing, but I just want to set everyone straight on this issue as it rears its ugly head yet again.

Every time the media sees the metals rally when the stock market declines, they begin to parrot the ridiculous claim that the metals are a safe haven for market volatility. Anyone who makes such a claim knows nothing of market history. If they did, they would not ever make such a claim.

(more…)

MSCI World Index at Critical Support Level

By -

I last wrote about the MSCI World Index in my post of February 10 as one of the volatility gauges to monitor for clues in equity direction. At that time, its price was 2050.90 and I mentioned that 2032.74 was a critical major support level to watch.

Since then, it has dropped further and closed just above that level on Friday, as shown on the following weekly chart.

I’d reiterate that a drop and hold below that level could send all world markets into a tailspin. The dramatic and swift plunge of the momentum indicator (which began in late January) is hinting of further weakness ahead on this timeframe, unless we see a swifter and convincing (sustainable) bounce soon. In the meantime, look for wild swings in this index, particularly this coming week, and beyond. (more…)