
That's right – I revel in being politically incorrect. It's almost Christmas on my calendar and I enjoy responding to 'Happy Holidays' wishes with a Clint Eastwood sneer and a stubborn 'Merry Christmas to you too!'. Anyway, after being pounded by a six day series of rainstorms the heavens suddenly opened up yesterday afternoon to bestow Los Angeles with a beautiful Christmas present:

Contrast that gorgeous view with the nasty weather Europe is having to put up with right now and you understand why I moved my Teutonic butt to California almost two decades ago. As much as I cherish the Christmas season – I can assure you that winters in Europe (as on the U.S. East Coast) are no laughing matter. You just can't beat the weather down here in Southern California.
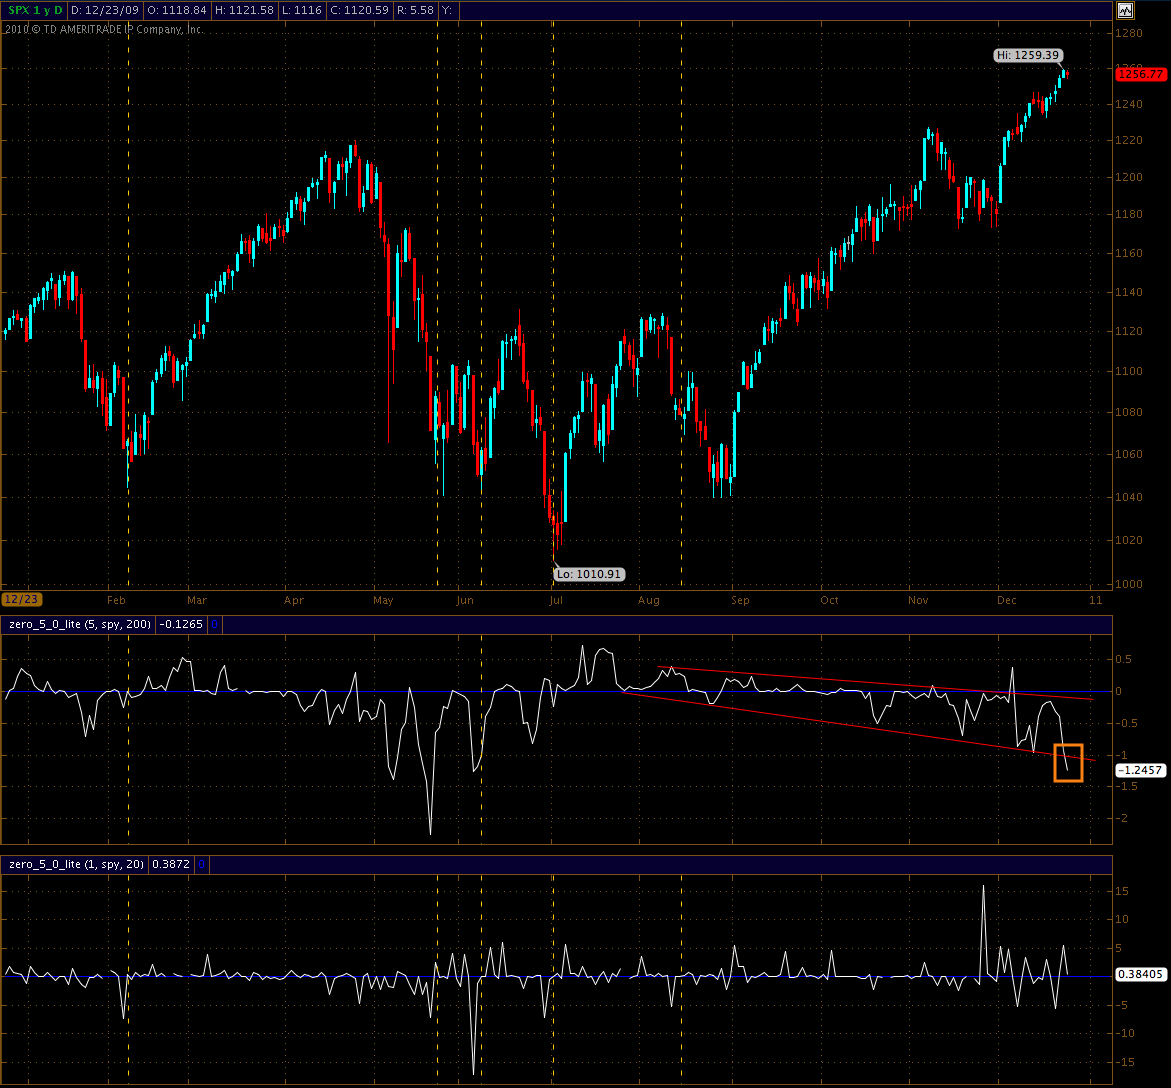
The smoothed version of the daily Zero has breached that lower support line and is now clearly pointing down. A signal like this usually suggests that some kind of reversal is on the horizon, but if we're objective here the signal has been in the negative for a while now. So, it'll better happen when it's supposed to happen – which is usually in the first two weeks of January. Let's wait for that and then revisit this chart to see if it's supportive.
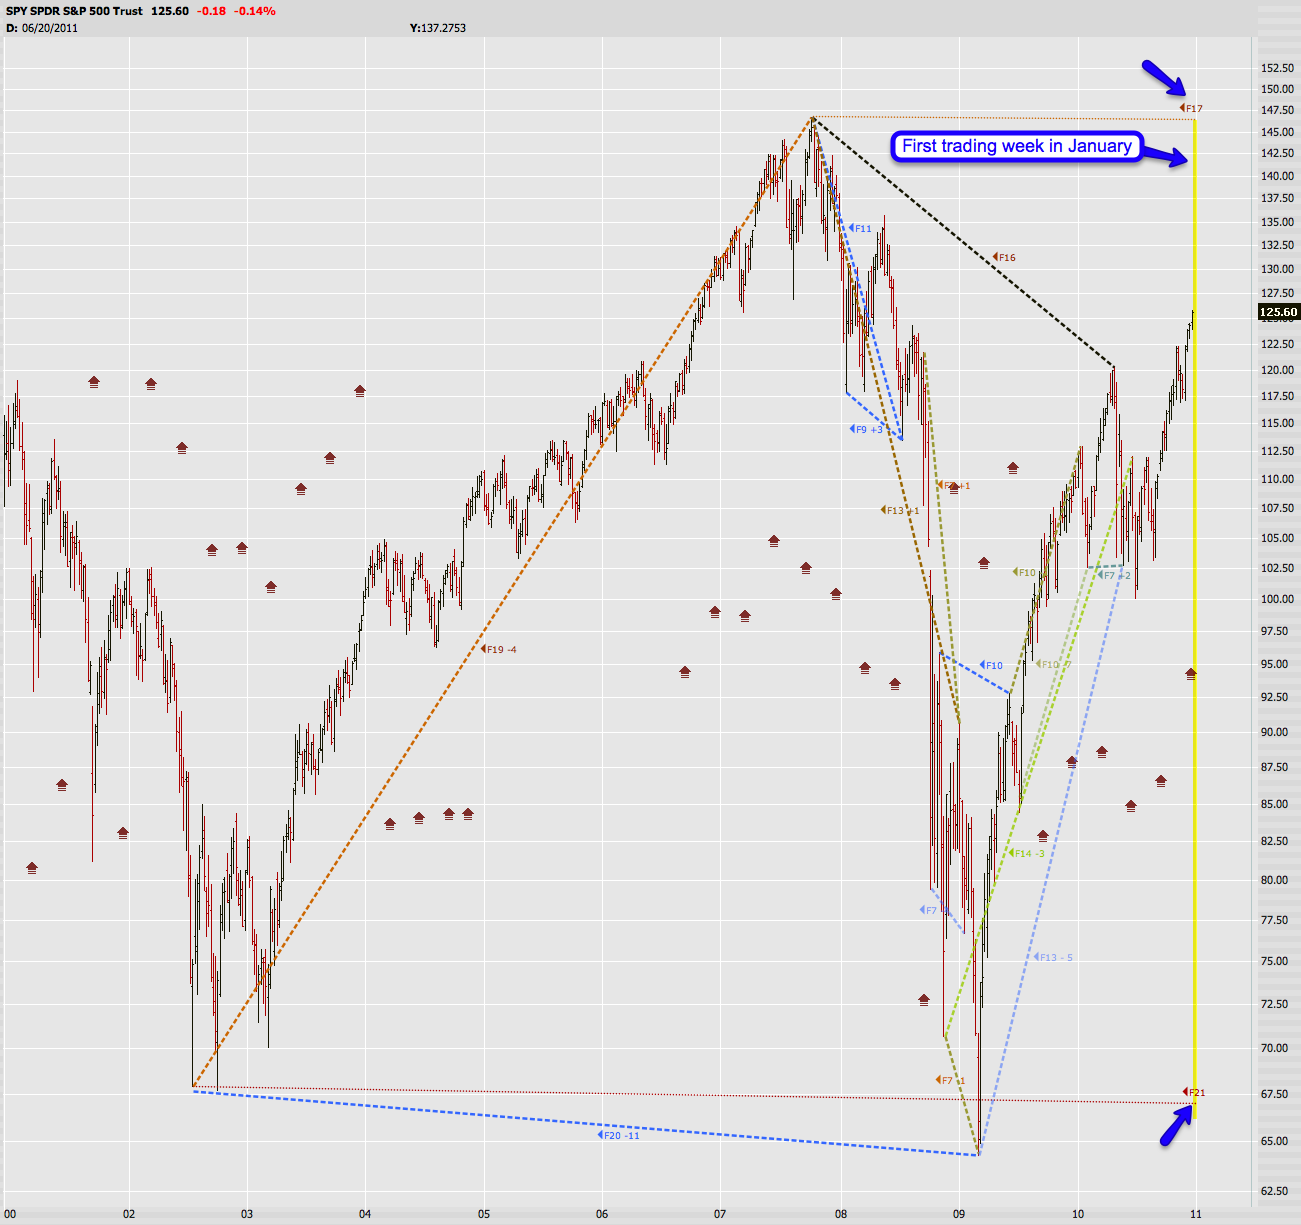
You may remember my spiral calendar chart which I pull out of my head every once in a while. If you don't know what this means then just use the search box on your right with the keyword 'spiral calendar'.
Another reason why we may be heading into some type of correction are two major cycle intervals – one being a F21 (i.e. 3090 days) and the other one being an F17 (i.e. 1180 days) – shown on my SPY chart above. In terms of sheer seasonality and given the current bullish exuberance exhibited by the longs the overall market conditions do support a drop. Why a drop? Well, we have been melting up forever so a turn date for the longs would not make any sense. Of course we have seen cycle dates come and go before – granted, none of them was above F20 and as far as I understand it the longer term cycle dates do carry a bit more weight. So I'd give this one much higher odds than any of the dates I've shown here previously.
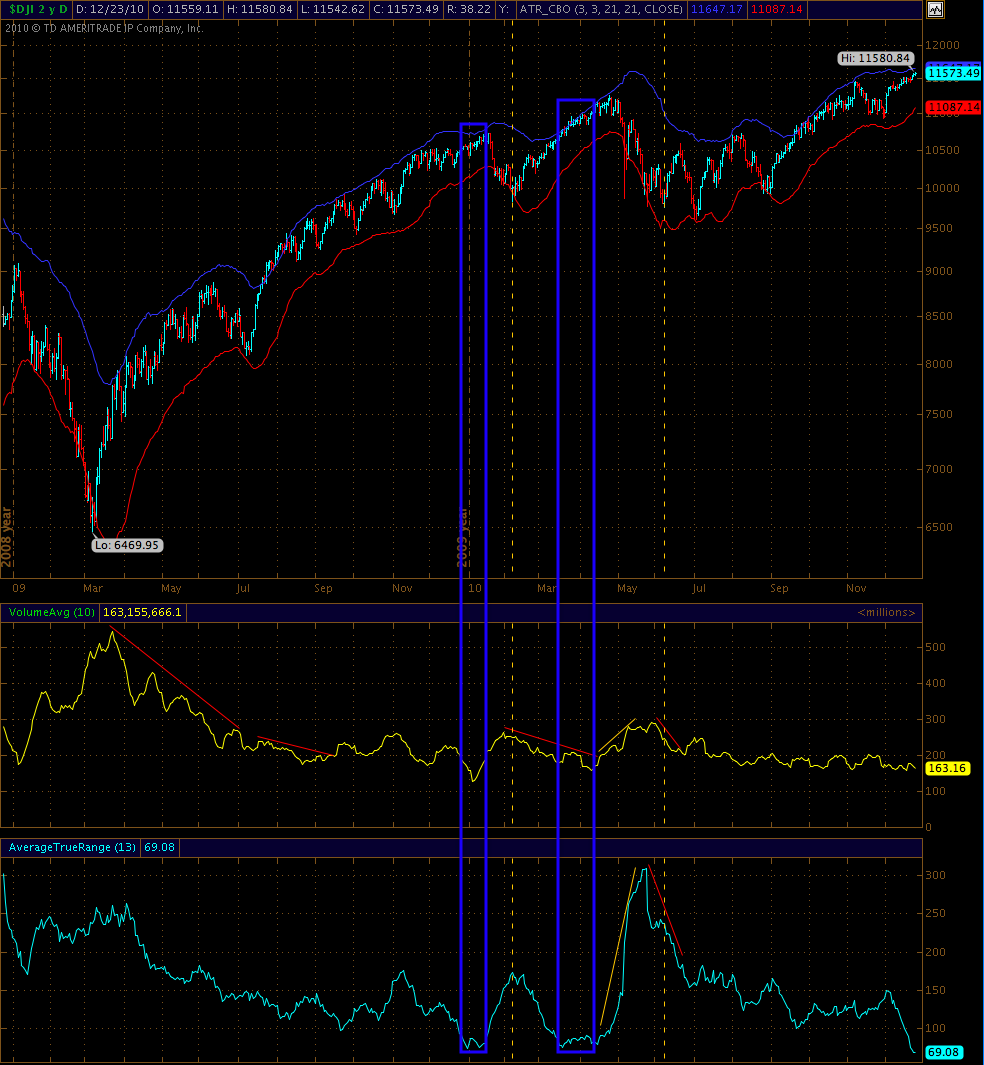
Alright – one more before I hit the eggnog. I'm sure many of you are familiar with the concept of average true range (ATR). If not do a google search or just believe me that it's an important measure of volatility. And while we've seen volatility on the (un-smoothed) daily Zero increase it's been dropping like a rock on the nominal side of things. When the longs get that complacent and everyone expects stocks to keep taking the express elevator up bad things usually happen. Case in point – take a peak at similar readings last January and then again in April. Of course what's also apparent from these prior readings is how long things can stretch out. So, we may have to wait while equities paint a blow off top before we'll see a meaningful drop. Given the onslaught of POMO auctions scheduled for the next few weeks I would not be surprised to see exuberance get completely out of hand.
Mmmh – actually that ATR observation got me thinking. How difficult would it be to slap an ATR on the daily Zero?
UPDATE: Well, I decided to get off the eggnog and hack together my first draft of the proposed ZeroATR:

Not so shabby – is it? I can probably fiddle with this a bit more but it looks pretty valuable to me. I'm going to slap it on the hourly and ZL as well and see what happens. Stay tuned on that end 😉
Wishing all of you Slopers a very Merry Christmas and a happy new year!!

Alright, here's your f*cking Christmas card – now go away.
Cheers,
Mole
