Yesterday's bear setup was a disappointment. The ES and EURUSD channels both broke up but the really interesting action happened overnight, mainly because of what should have happened, but didn't. I'll explain with the charts.
EURUSD broke the short term declining channel at the close yesterday, and as I expected it rose quite a bit overnight. A short term rising support trendline was established overnight which has just broken while I've been writing:

Generally speaking, in a move which saw EURUSD rise over 120 pips, I'd expect to see other USD currency pairs and equities rise too, but that is the very interesting thing that didn't happen last night. Of the currency pairs GBPUSD didn't move much or at all:
On equities ES and Nasdaq were flat, and the Nasdaq broadening descending wedge that I posted yesterday is still intact, though there was a pinocchio up through it at the close:

So what does this mean? Possibly nothing, but the way I would generally interpret a dollar move down with equities flat is that equities are in a larger wave down, and will resume moving down once USD reverses back up, as it may be doing right now. While NQ and ES fail to make new highs, that's what I'm wondering this morning. It is worth mentioning with that however that the ES and NQ overnight could be interpreted as bull flags, and on Opex Friday all sorts of strange things can happen.
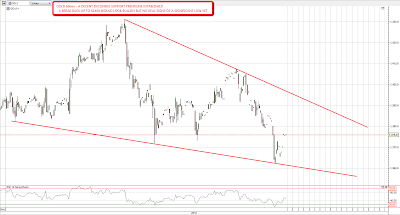
I've been having a look at gold and silver this morning and a nice looking declining support trendline has been established on gold. With the declining resistance trendline we could have a falling wedge on gold, though the resistance trendline really needs another touch to confirm it. If gold can make it back up to 1400 I'd see that as a bullish break:
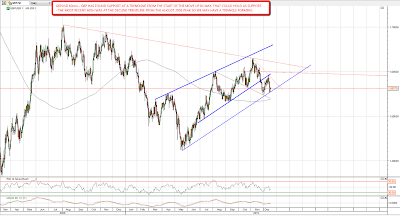
The silver picture looks more complicated and I've taken a broader view on that chart. Right now we have a triangle forming that could obviously break either way. I'm still leaning short on silver but a break up through the declining resistance trendline would look bullish. For the bear side a break down through the triangle support trendline would open up a return to the main support trendline from $18. If that breaks then the way is open for a much deeper retracement.

One comment to make about triangles though is that they are pigs to trade, as they have a very nasty habit of breaking in one direction and then playing out in the other. Wedges, which are a sort of triangle really, sometimes do the same with overthrows or underthrows, but generally to a lesser extent and with an easier exit on the reversal. Something to consider on silver particularly if that triangle breaks up.


