Originally published on TheTechTrader.com.
Slope of Hope Blog Posts
Slope initially began as a blog, so this is where most of the website’s content resides. Here we have tens of thousands of posts dating back over a decade. These are listed in reverse chronological order. Click on any category icon below to see posts tagged with that particular subject, or click on a word in the category cloud on the right side of the screen for more specific choices.
My Morning’s Inbox
I woke up to this:
Appropriate combination, yes?
Anyway, here's what Tony sent me (which I appreciate). An ungodly high bull/bear sentiment:
DIA at 78.6% Retracement Level
For what it's worth……which, given the government's massive intervention, is probably zilch:
Crude Breakout
Holiday Patterns (by Springheel Jack)
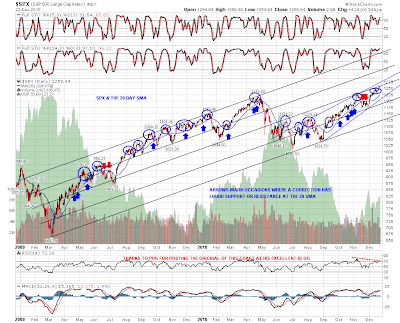
It's been very boring watching the market grind steadily higher this week, and I'm wondering now whether we'll see any correction next week. We're overdue a visit to the SPX daily 20SMA and I'm expecting to see a return to that soon, but quite a number of significant milestones were passed this week, and I'm wondering now whether we'll see 1280 before correcting. I've marked up the current rising wedge on the daily SPX, and also the main SPX rising channel since March 2009, onto my daily 20SMA chart to give a good idea of exactly where SPX is now within that bigger picture:
On the much smaller picture ES has broken down into the lower half of the recent rising channel. I'm expecting to see a return to the bottom of the channel today and will be watching that for a break. If we see a break down that should signal a deeper correction next week:

The Vix has been signalling an imminent correction all week and is still signalling that imminent correction. The key support trendline was hit on Friday and then again yesterday. Here it is on the weekly chart:

I've been having a careful look at USD today and on the EURUSD chart we have been consolidating sideways all month within the main declining channel. The blue support trendline on the EURUSD chart is being tested as I write and a break of that should signal that a more aggressive wave down is starting. That would have a very good chance of carrying equities down some way with it:

GBPUSD looks somewhat different, but is also in a declining channel from the early November high. A falling wedge has formed which may limit further downside. I have two alternative lower trendlines for the wedge but an upside breakout through the upper trendline would look very bullish and would signal an earlier than expected reversal:

I posted triangles on silver and gold earlier in the week and silver is still in that triangle though gold has broken down within a falling wedge. I'm looking for a break down on both and a break up would look very bullish both for for them and also for equities. Here's the triangle on silver:

One thing that has made me much less confident about an imminent correction on equities is watching the very strong action on financials. XLF blew straight through my 15.9 target yesterday and my next target is in the 16.3 area. If it makes it there then I'd be seeing a move to rising wedge resistance in the 1280 SPX area as likely. We'll see what happens today.
This is my last daily post before Christmas so everybody have a great Christmas, and for the non-christians, have a great holiday. 🙂
