The first thing to mention this morning is that I haven't yet switched over from June to September on the ES, NQ & TF e-mini charts. I tend to do that on the Wednesday of opex week to keep my e-mini continuous charts showing the same prices as my other e-mini charts. Volume has already switched over to the September contracts of course, which are now showing twice as much trading volume as the June contracts.
The second thing to mention is there was a technical glitch with the posting of Friday morning's post, when the last third of the post vanished into the digital ether as I published it. I copied the lost EURUSD chart and summary back from the copy at slopeofhope.com three hours later when I noticed the omission, but there must have been quite a few people wondering why it ended very suddenly, and it was disappointing that hardly anyone saw the EURUSD before the bulk of Friday's sharp fall had already happened. I'll be trying to get back to my normal blog schedule now, as it's now been two weeks since I broke my leg, and swelling round the breaks is less of an issue so I can now spend longer periods at my desk. In a week or two I should be able to spend all day at my desk so I'll be fully back to work.
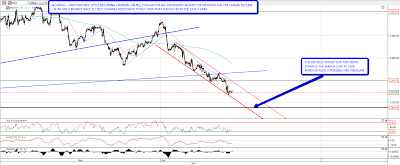
I have a nice little declining channel on ES for the move down from 1320ish. Looking at ES I'm wondering about a bounce today, and if we see that then resistance is in the 1287.5 area (June).

I have another little declining channel on NQ from the 2330 area. NQ is looking weaker than both ES and TF, and if we see a bounce there channel resistance would be in the 2243-7 area:
TF is definitely the strongest of these three e-minis this morning and interestingly I have a falling wedge on TF at the moment, though a break up of a point or so could convert this into a declining channel. Wedge resistance is in the 788 area:

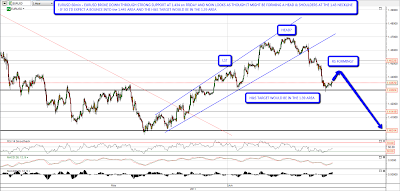
EURUSD declined to a potential H&S neckline on Friday and is bouncing from there. If a right shoulder is forming then the upside target would be in the 1.445 area, though it could get to 1.4525 without making the pattern look too strange:
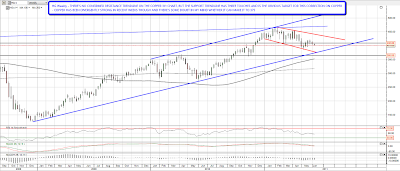
Copper's been a bit of a disappointment in recent days with a very fitful and shallow move down from the broken rising wedge.I'm expecting a move to strong support and the potential H&S neckline at 395, and if that can be broken, then the rising wedge target is at 385, and strong 30 month rising trendline support is at 375:

That 375 target is at a trendline I should post again today. It's a decent trendline and a hit there could well mark a major low on copper if it is reached:
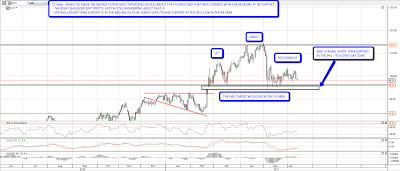
Oil's been chopping sideways for the last few weeks, and there is strong support in the open gap zone at 94.1 to 95.6 that held on multiple tests in May. If that support can be broken then there is now a possible H&S on oil with a target in the 76 area, though there is very strong longer term support in the mid-80s that I'd be expecting to hold.
Direction looks uncertain today and I'm leaning towards seeing a bounce. Monday's have been extremely bearish lately however, and any bounce may struggle against that. Of the last thirteen trading Mondays since this bearish Mondays trend started there have been ten closes down, one flat, and two up, losing a total of 60 points on SPX on a close to close basis.
It's also opex week this week of course and there is a big potential cycle turn date coming up tomorrow / Wednesday that could mark a significant low.
