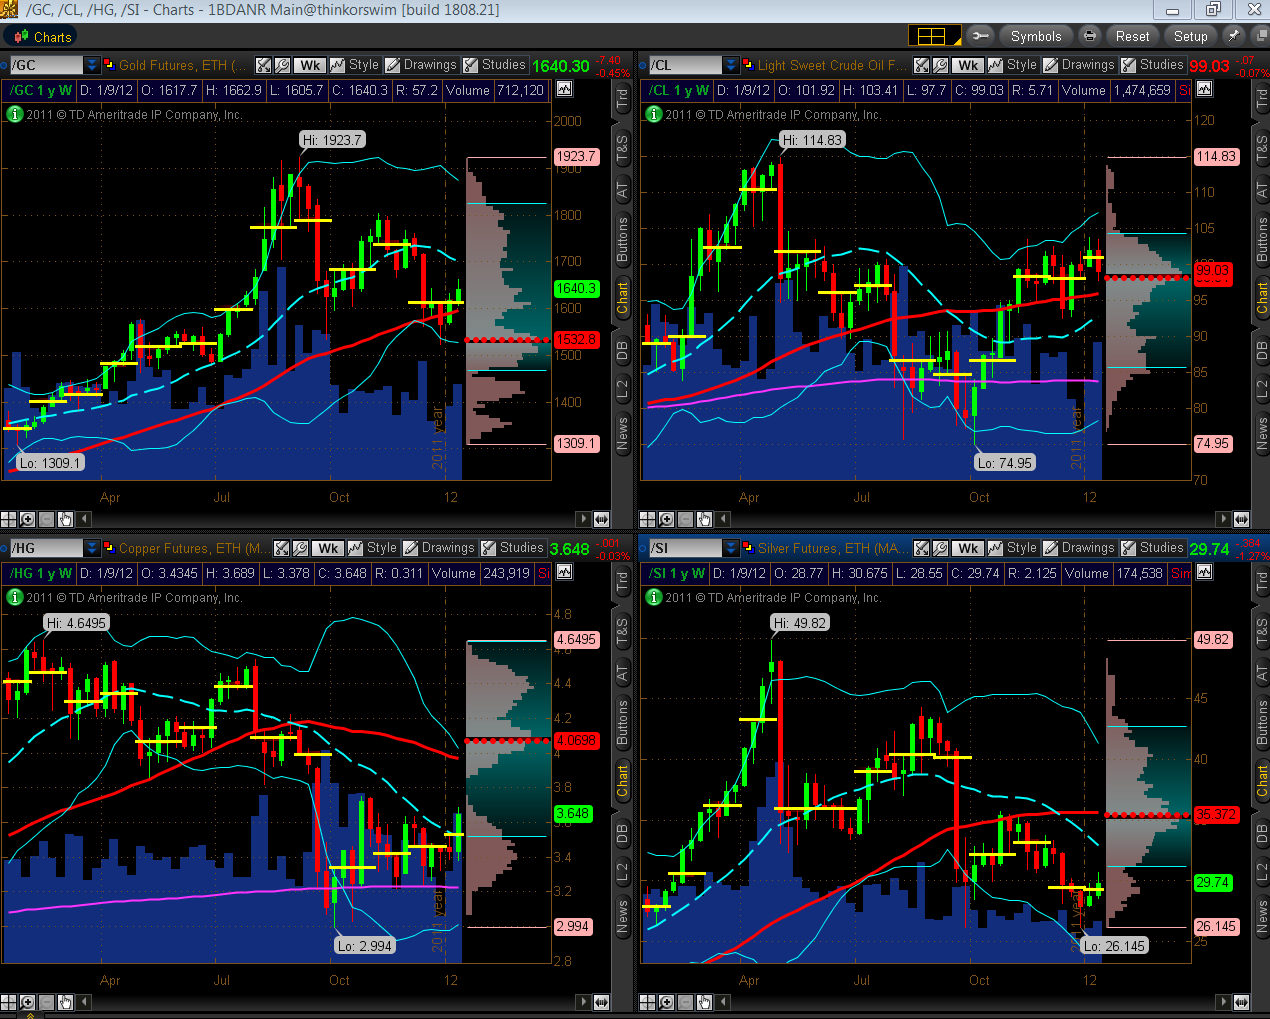
Below are Weekly charts during a one-year time period of Gold, Oil, Copper and Silver with Bollinger Bands, 50 sma (red), monthly Volume Profiles (horizontal yellow lines are POC), and a one-year Volume Profile at the right edge (red horizontal line is POC).
While Oil pulled back this past week to confluence support, Gold, Copper and Silver rallied. For this time frame, if Copper and Silver continue to rally, they will be returning to their "mean" (50 sma and one-year POC), and if Gold and Oil rally, they will be adding risk by moving away from their "mean." Volumes were higher last week, and potential targets on the upside are mid-to upper Bollinger Band, as follows:
- Gold – mid-Bollinger Band at 1700ish
- Oil – upper Bollinger Band at 107ish
- Copper – upper Bollinger Band at 4.00ish
- Silver – mid-Bollinger Band at 32.70ish
Below are OPEX charts during a 5-year time period of Gold, Oil, Copper and Silver with Bollinger Bands, 50 sma (red), and a 5-year volume Profile at the right edge (red horizontal line is POC). Each candle represents a one-month Options Expiry period and the current candle will close on January 20th.
While Gold and Silver initially dropped since December 19th, they have rallied and look poised to continue their rally, while Copper has shown the most strength, followed by Oil. They are all above their "mean" on this time frame, and any rally will indicate further risk appetite for these commodities. Copper and Silver are just below their mid-Bollinger Band at 3.80ish and 30.60ish, respectively, so it will be worth watching these two to see if it acts as resistance, while Gold and Oil have their upper Bollinger Band as potential targets on the long side at 1850ish and 108ish, respectively.
Since volumes are considerably lower for this OPEX period, any rally or decline on the current candle would need to be confirmed by the next OPEX period's action and close. In this regard, upcoming Daily and Weekly volumes may give further clues as to commitment in either direction…especially if we see parabolic moves to the upside on progressively increasing volumes.

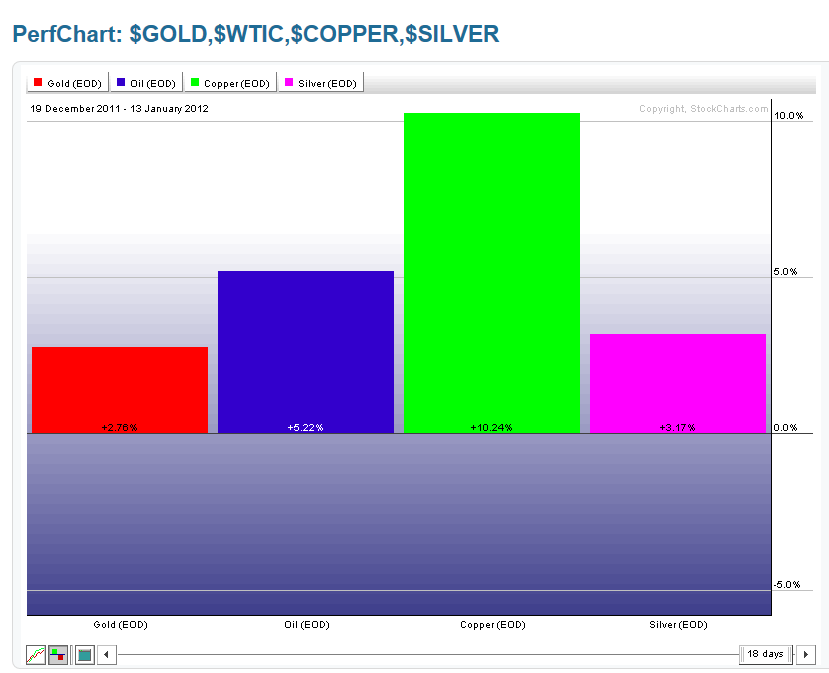
The following two histogram graphs (available at www.Stockcharts.com) show percentages gained/lost for the past week and for the current OPEX period. We can see that Copper, in particular, has been very strong for both of these time periods, and that, while Oil declined last week, it is still second in strength during the OPEX period, with Gold gaining the least.
We'll see if Dr. Copper stays strong in the coming days/weeks and what volumes say…and how equity markets react.