
In total, from the October 2011 lows, the Russell 2000 Index has led the Dow 30, S&P 500, and Nasdaq 100 indices higher in terms of percentages gained to date, as shown on the percentage comparison chart below.

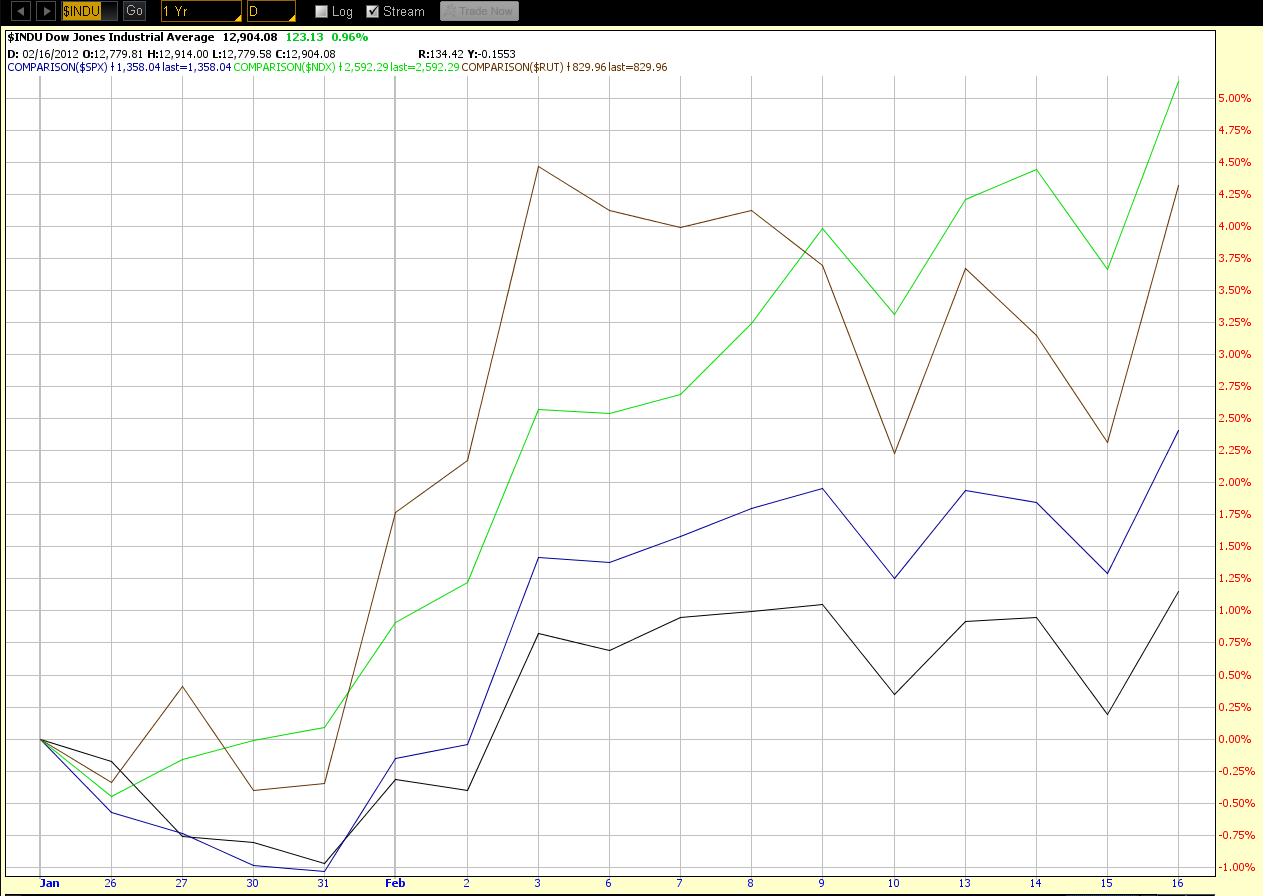
The next chart shows percentages gained since the November dip/lows. The Nasdaq 100 started to gain momentum towards the end of January and pulled ahead of the Dow and S&P 500, while the Russell maintained its lead.

The next chart begins at that point where the Nasdaq pulled ahead…it then pulled ahead of the Russell on February 8th.
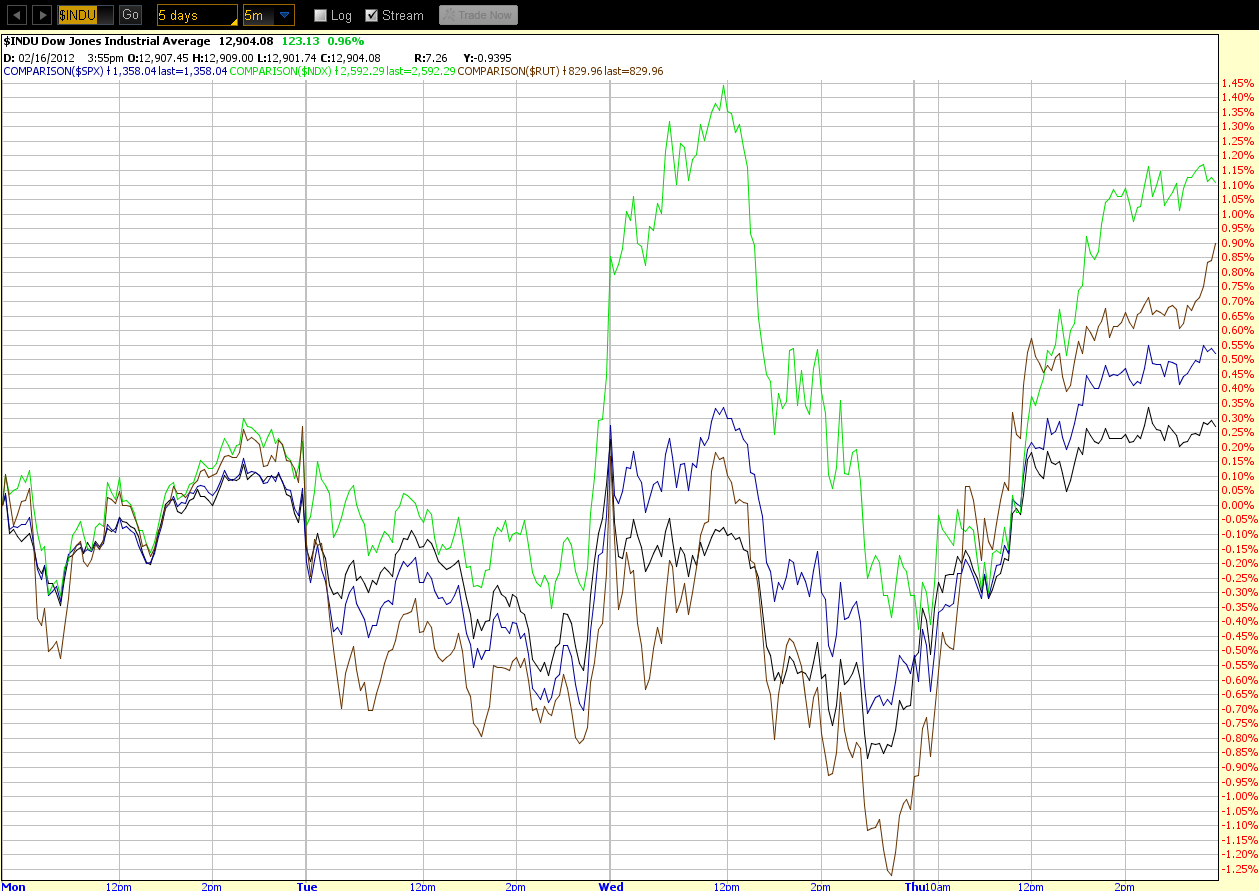
The next chart begins on Monday this week…the Nasdaq surged once again on Wednesday, and, as of today's close, it remains the leader, so far, for the week, followed by the Russell 2000, the S&P 500, and the Dow 30.
In summary, I'd watch for any early signs of weakening in the S&P 500 and the Dow 30 indices, as a potential warning that equities may be about to roll over. The last chart depicts today's action only…price flattened out around 1:30pm on all four indices, with the Russell leading the indices higher from the open today. I'd look for a resumption of buying tomorrow, otherwise, this afternoon's flat price action may be a precursor of such weakness developing.

http://www.strawberryblondesmarketsummary.com/
