
I have no great love for triangles, as I’ve mentioned a few times before, and this year has produced a bumper crop across the equity indices, which is tiresome. We’ve been kicking around in the current one for three weeks now, and as ever, it has been an annoying bore.
So where do we start this week? Well everyone seems convinced that SPX is going to break up to a retest in the 2020-40 area, and I’m still very doubtful about that for two main reasons:
1. My 5DMA stat requires a retest of the 1911 low before a break of the last 1988 low. Could the stat fail to deliver here? Yes, any historical stat can fail, but having seen dozens of these 5DMA Three Day Rule setups since the start of 2007 I have yet to see one fail, and I’m not seeing any compelling reason to think as yet that the first fail will be here. From an odds perspective, if fifty solo lemmings leap off a cliff and drown, then the working assumption for the fifty first lemming leaping off the cliff should be that it will drown too. That isn’t destiny, that’s just math. As ever there is a possibility that it could go the other way, but most likely it won’t.
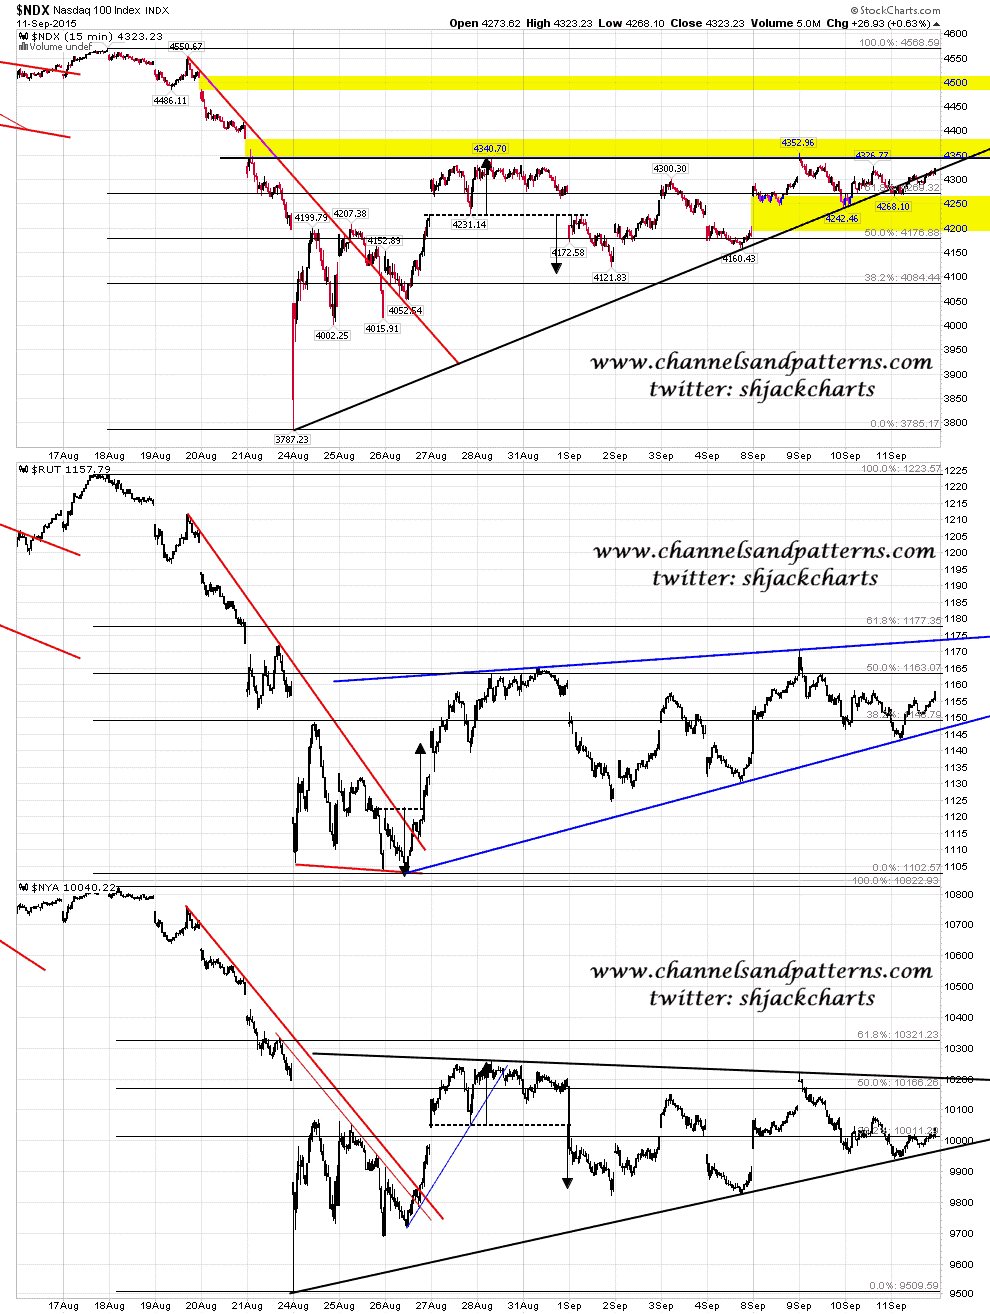
2. On the six equity index charts below I have three ascending triangles, two rising wedges, and one symmetrical triangle. What these patterns have in common is that the targets on a break up would not be in the 2020-40 SPX area or equivalent. The targets are all close to retests of the current 2015 highs, except for TRAN, which would target a retrace back to the June highs, as TRAN has been declining since an early all time high last year. My doubt is therefore less that SPX may not want a retest of the 2020-40 area, and more doubt that on this pattern setup that SPX would reverse there if reached. The obvious target on SPX at that point would be at the retest of the all time high. The same would apply to both INDU and NDX particularly, with more room for lower highs on RUT, NYA and obviously TRAN. Scan 3x 15min SPX INDU TRAN charts:

In terms of judging when these setups are breaking I’m looking at the NDX chart, with gap resistance above and gap support below. Whichever of those gaps fills first is most likely going to be the breakout direction. Scan 3x 15min NDX RUT NYA charts:
So assuming the stat delivers and 1911 is retested next, what then? Well the stat has nothing more to say after that test, but by that stage I think all of these six patterns would have broken down. At that point the obvious target would be a retest of the lows.
