
Apologies for the very late post today. I had a morning appointment that overran badly, and it’s slower work getting charts done after the markets open and I’m then trading as well as charting.
I mentioned on twitter last night after the close that the bulls narrowly managed to avoid a 5dma three day rule breakdown with a target at a retest of the lows. There was more downside overnight that reached my ideal target on ES at a retest of the 1850 area and ES then reversed back up hard there. There is a strange myth that globex highs and lows always need to be retested soon after. I’ve been watching that for a while and have seen little evidence to support this, and there’s no need to see that here.
Stan called the 1850 target and that should be the B wave low on this ABC rally. Where is C going? Well that’s where it gets interesting.
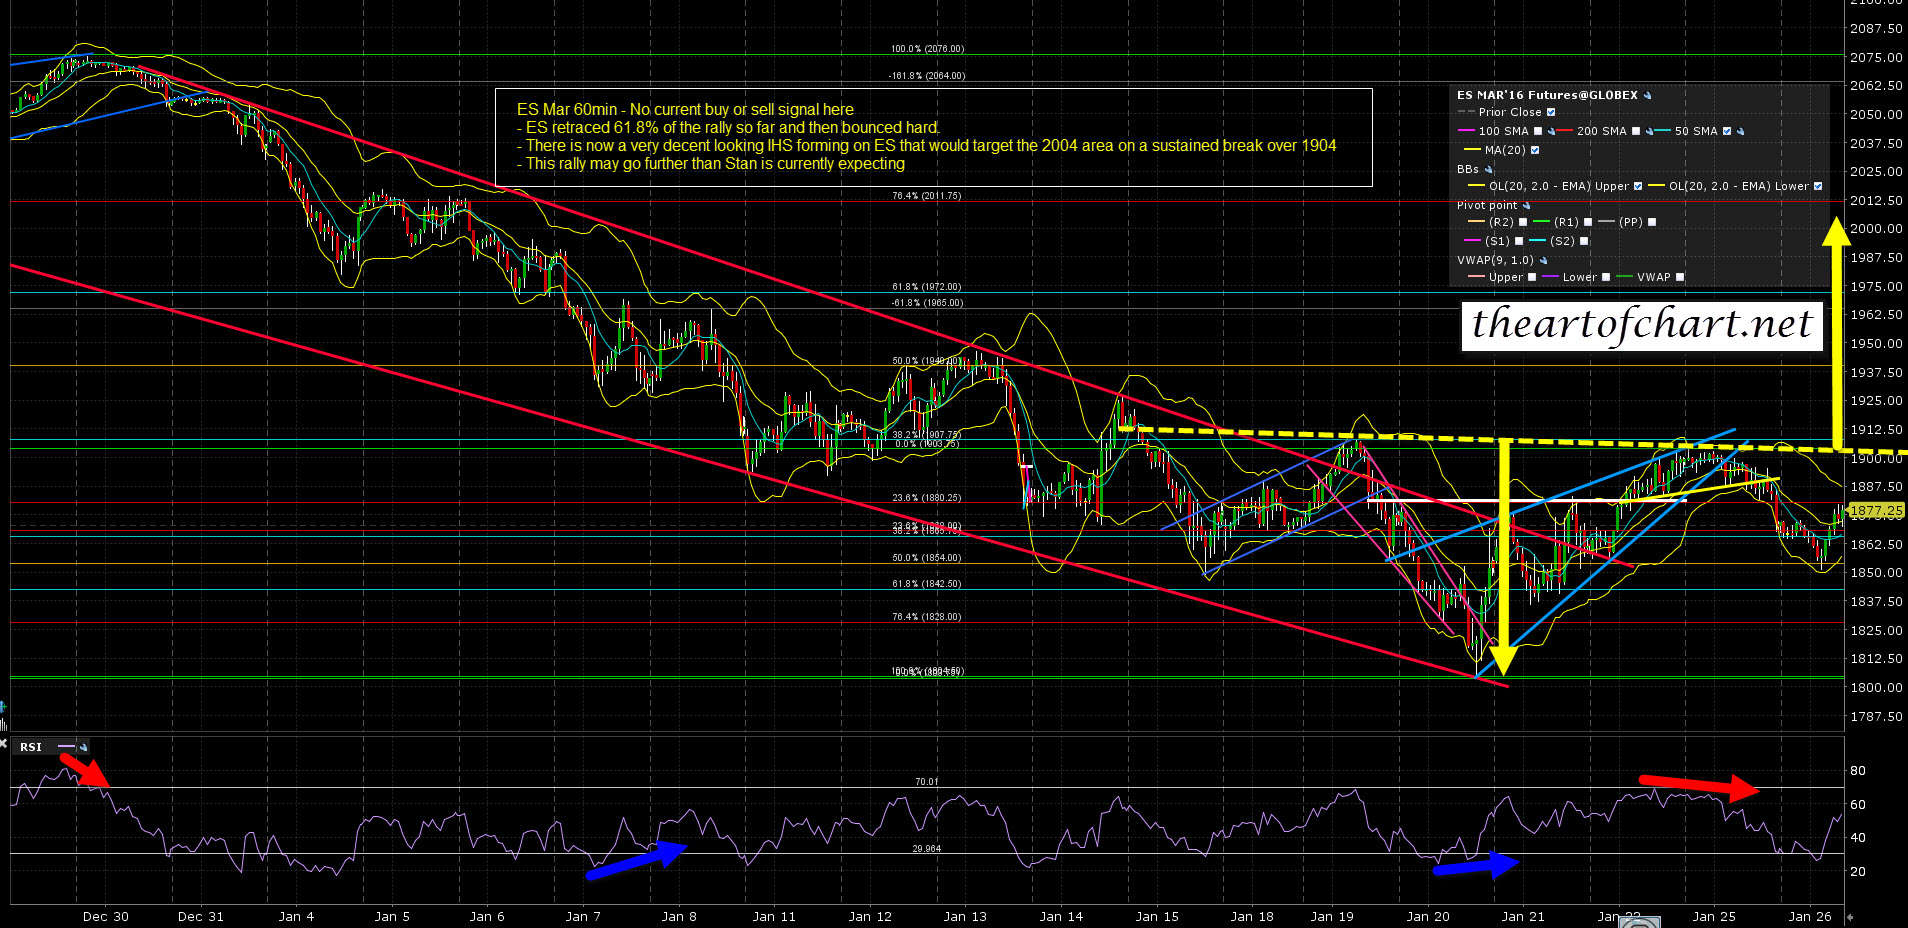
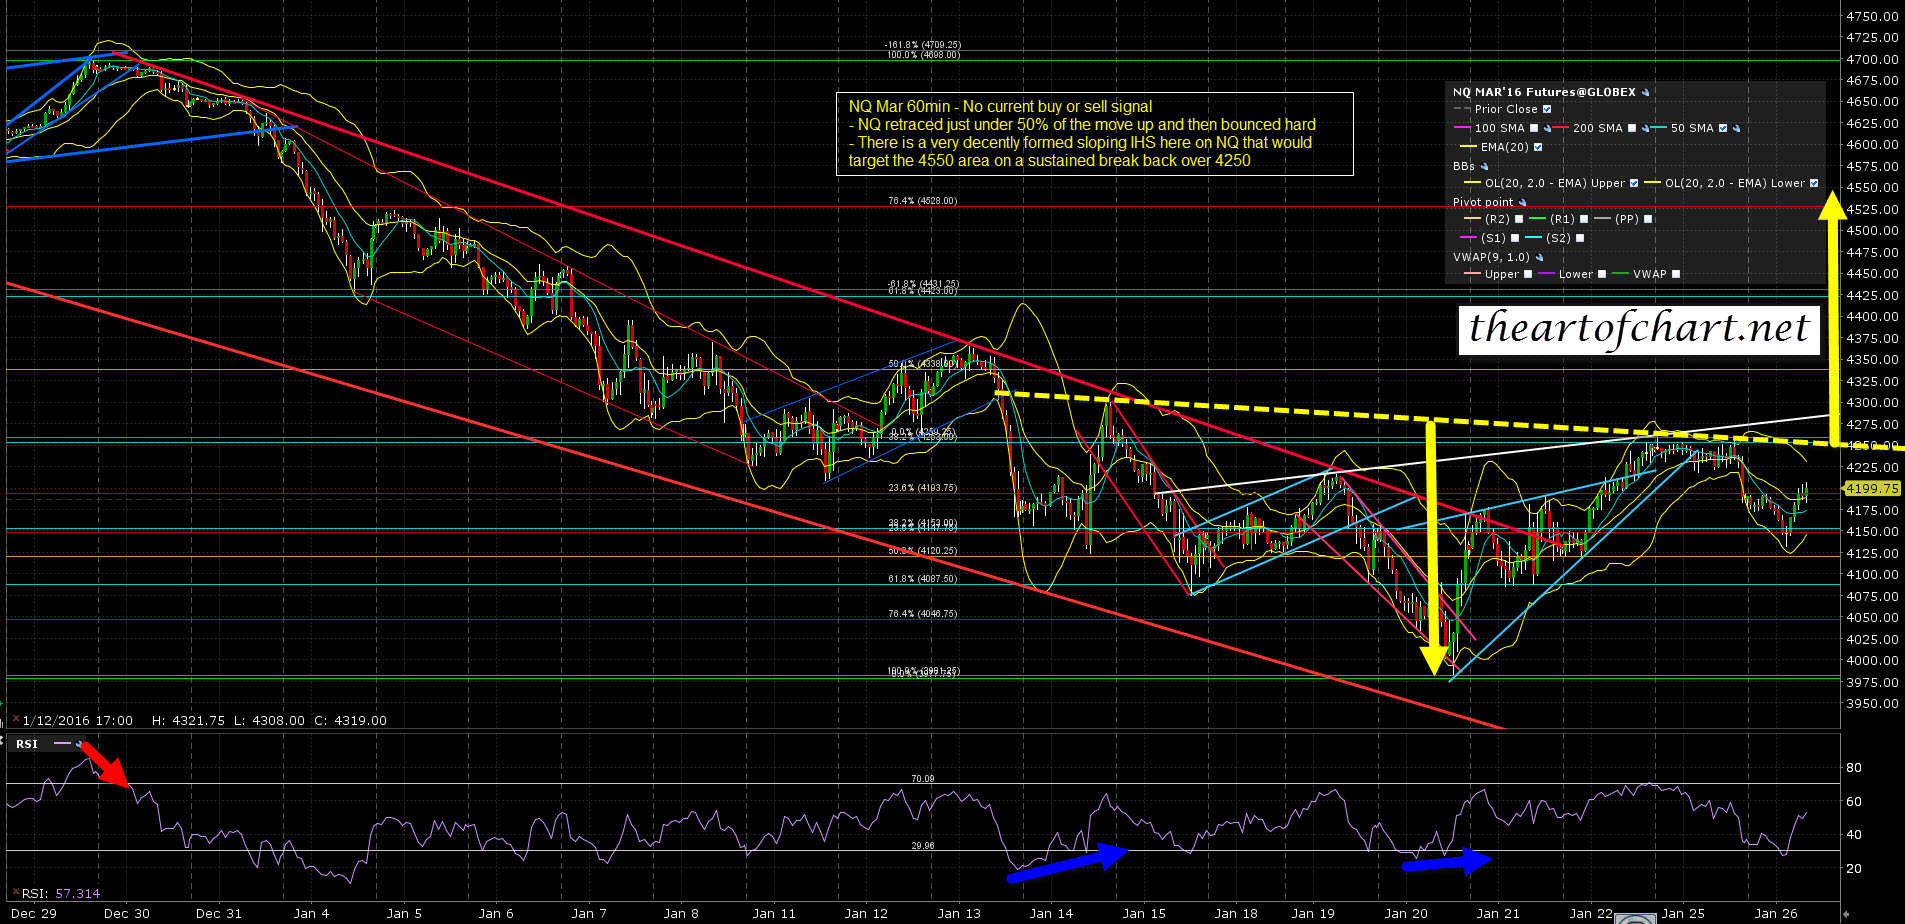
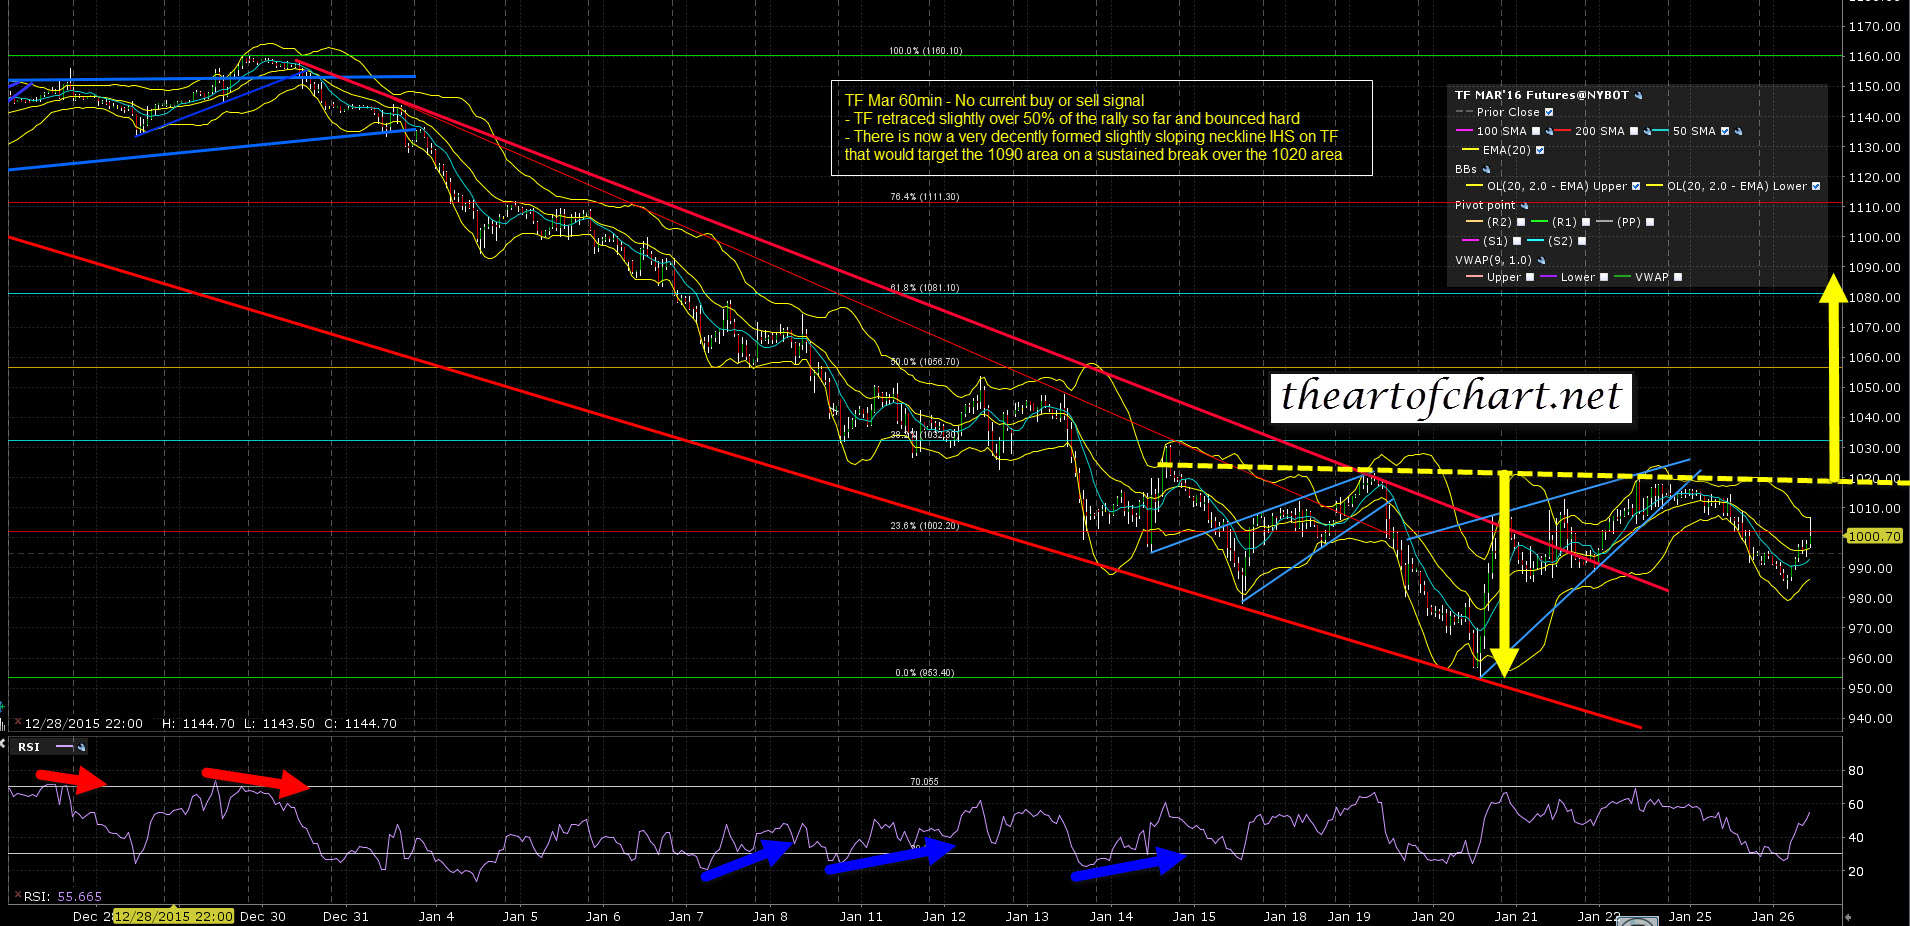
I’m posting the bonus charts that I have done this morning for subscribers at theartofchart.net, and the first thing to notice on the ES, NQ and TF charts is the very large mostly formed IHS patterns on them. These are now all fully formed and testing their pattern necklines. If they break up then that would make the obvious target for the C wave at a retest of the 100 week MA, currently at 2008 SPX. That is a very important resistance level in bear markets and was an obvious target area for any strong rally here. I would be very pleased to see that tested.
So below are the bonus charts for subscribers at theartofchart.net that I posted this morning. I do these every day and the standard set is ES, NQ, TF, DX, CL, GC & ZB. Of these ES, NQ, TF, CL, and ZB looked particularly interesting this morning & I mainly traded CL today, as the setup there was the nicest, and I managed to capture most of the move up from the open.
ES Mar 60min chart:
NQ Mar 60min chart:
TF Mar 60min chart:
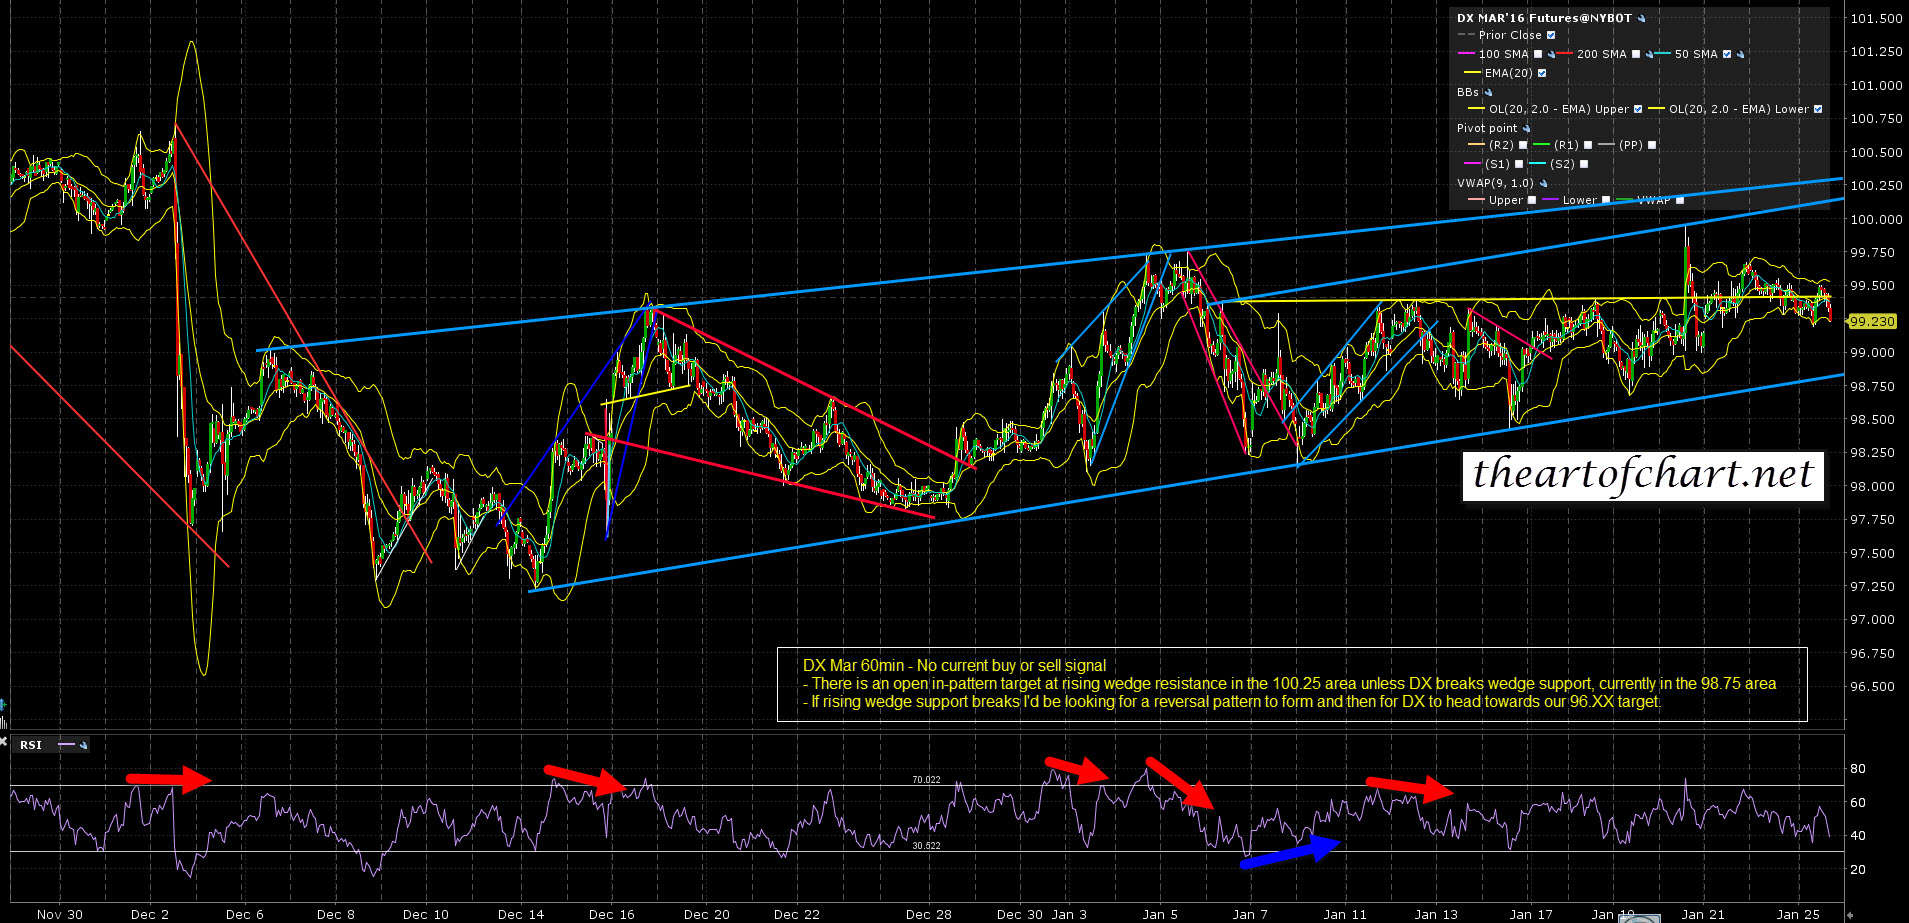
DX Mar 60min chart:
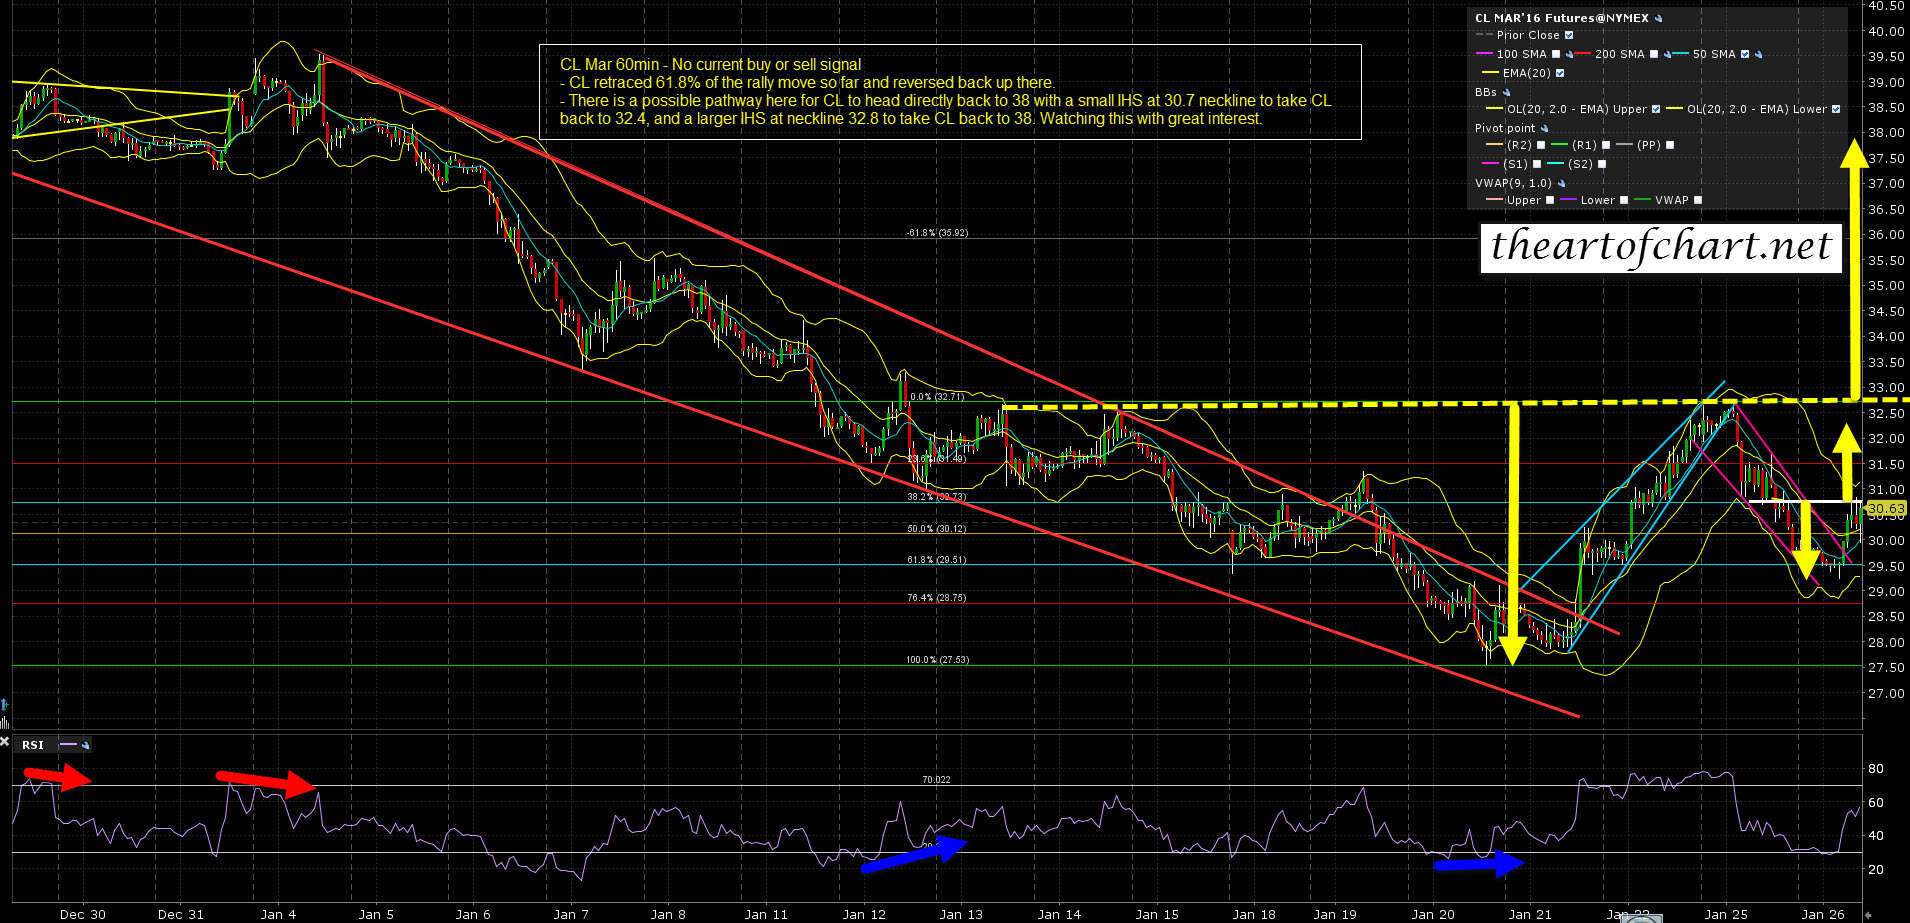
CL Mar 60min chart:
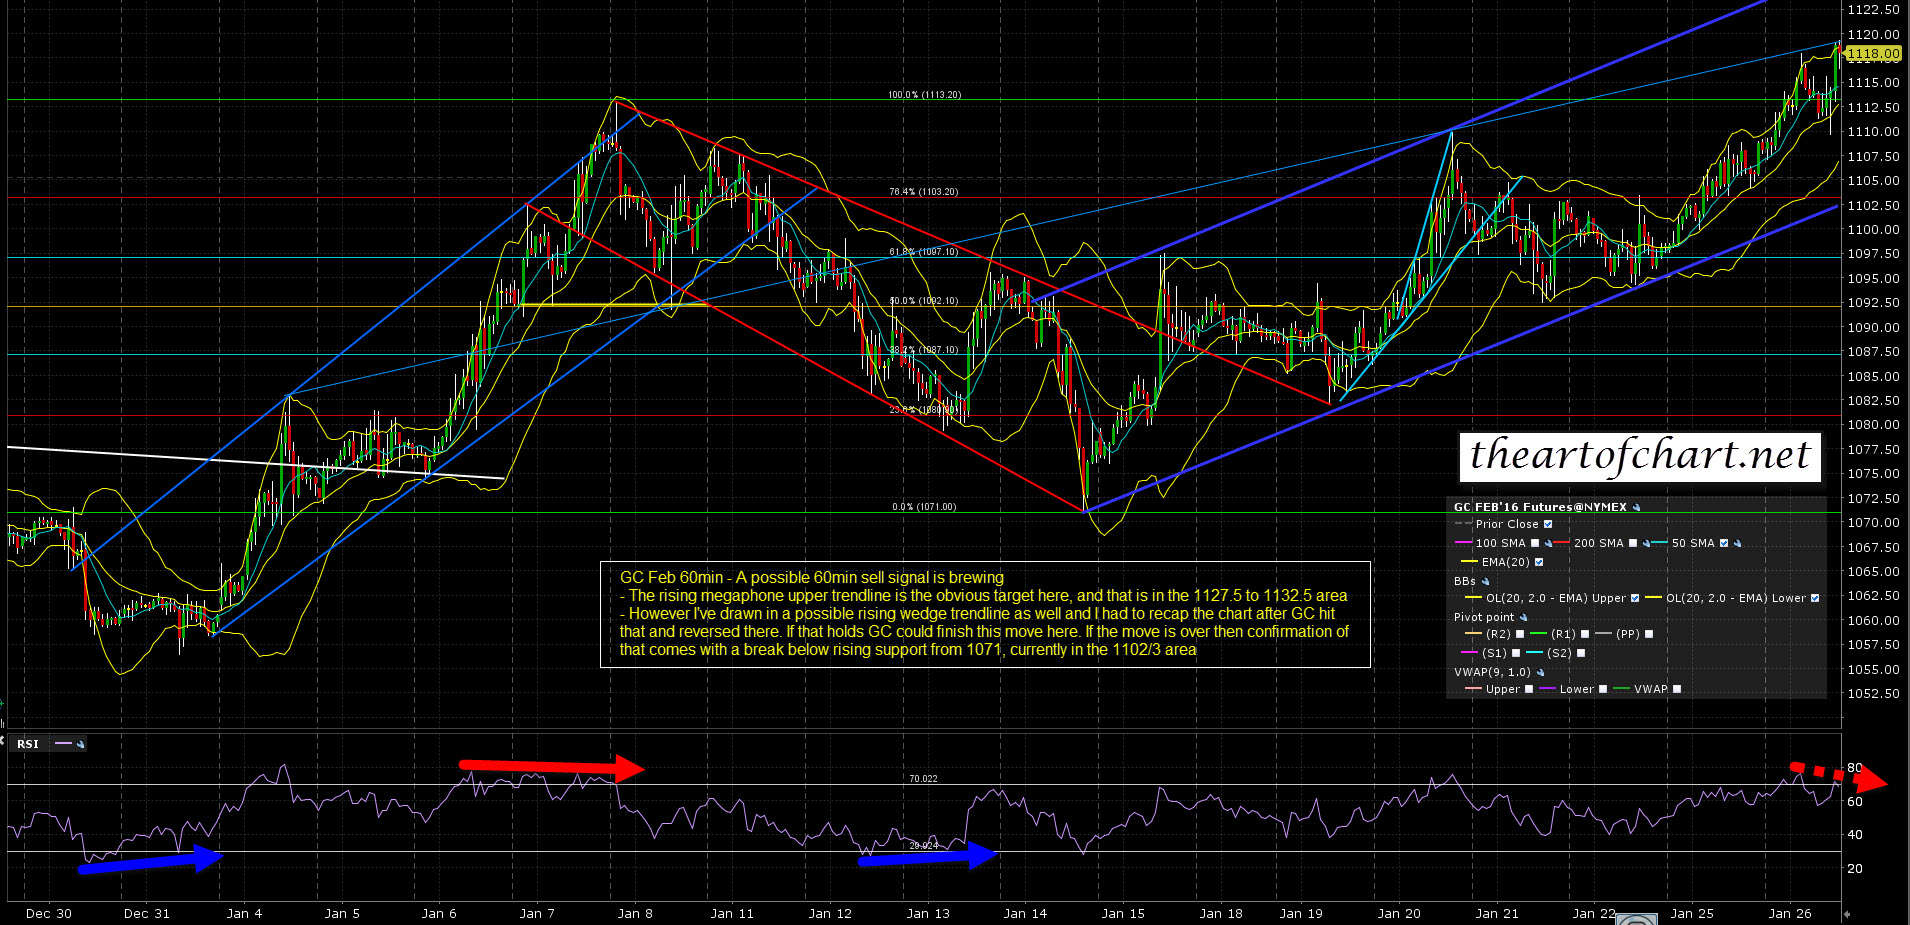
GC Feb 60min chart:
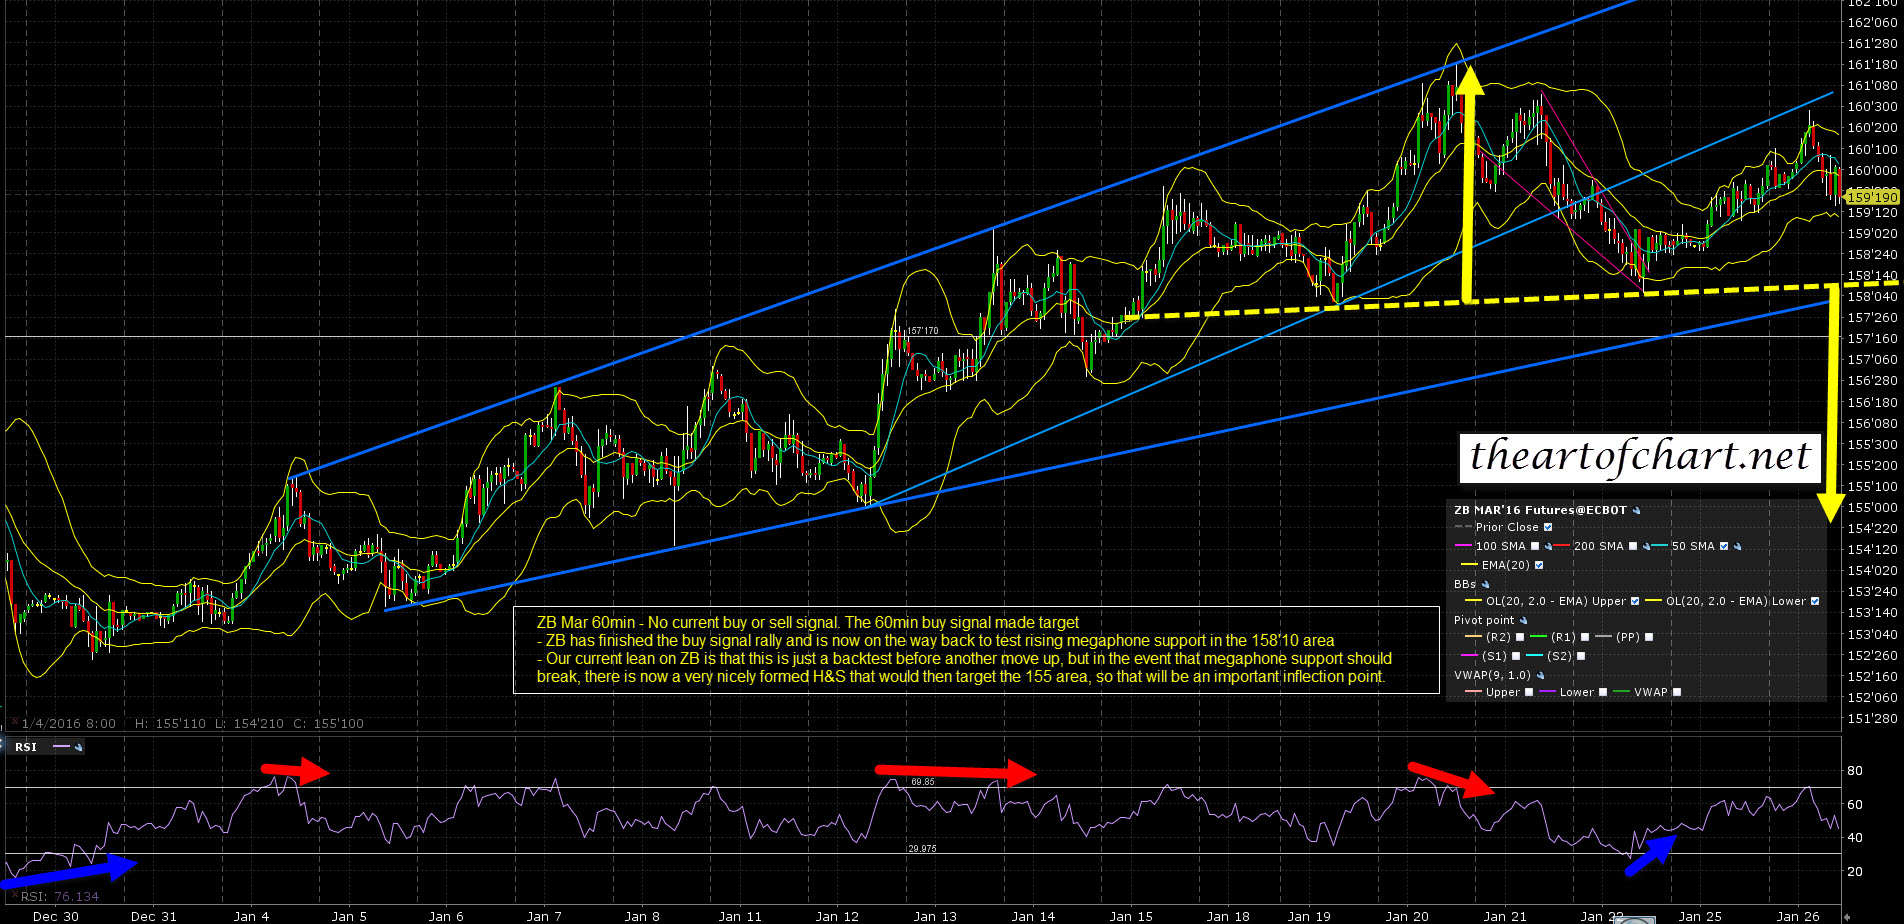
ZB Mar 60min chart:
The bulls are looking rather beaten up at the moment and I have some doubts as to whether they can manage a 2000 test, but the setup is there and if seen, that should set up the next big short entry very nicely. I’m rooting for the IHS patterns, though I don’t want January to close over 1990 as that would kill off the bearish (for 2016) January stat setup that I laid out a couple of weeks ago.
