Slope of Hope Blog Posts
Slope initially began as a blog, so this is where most of the website’s content resides. Here we have tens of thousands of posts dating back over a decade. These are listed in reverse chronological order. Click on any category icon below to see posts tagged with that particular subject, or click on a word in the category cloud on the right side of the screen for more specific choices.
Technology and Healthcare are the Big Winners of 2017
It’s all about the Technology and Healthcare sectors this year, in terms of gains made, so far, as shown on the following 1-year charts and year-to-date graphs of the Major Indices and 9 Major Sectors.
The laggard, Energy, may be poised for a recovery, if it can hold above its downtrending 50-day moving average.
The Materials sector is on the verge of new breakout. Keep an eye on GOLD and Gold Miners ETF, as I’ve recently described here and here.
The Russell 2000 Index is still mired in a large-scale sideways consolidation zone. Watch for any breakout (and sustained hold) above this zone as a potential signal of renewed and serious riskier asset-buying in the markets, in general. (more…)
The Joy of Text
I am very pleased to let you know about a couple of improvements in SlopeCharts.
First of all, there is a new element on the data line which shows the Y-axis value of wherever it is you are pointing on the screen. This can be useful if you are projecting a target on a chart (or for whatever reason). The x-axis is already there (since it’s a date), but now you can pinpoint the Y-axis with your mouse just by observing the value on the data line.
The other improvement is an enhancing to the existing Rectangle tool. As a reminder, to emphasize a specific part of a chart, you can use the rectangle highlight tool. Select it from the toolbar at the top of SlopeCharts:
Swing Trade RPM DO CCE
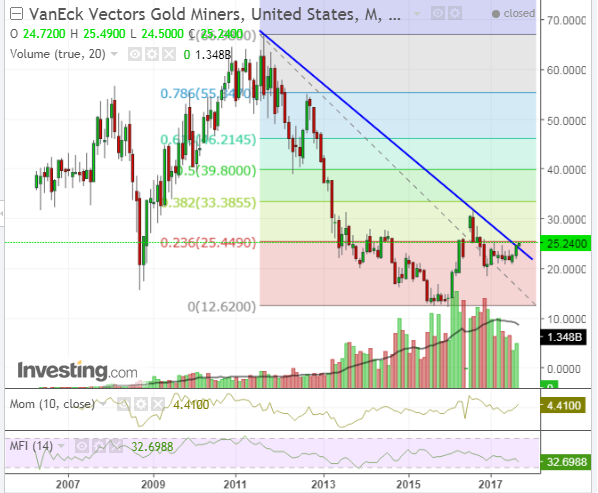
The “Squeeze” in the Gold Miners ETF
Price on the following GDX Monthly chart is currently being squeezed in between major resistance of a 23.6% Fib retracement level and a recent breakout above a long-term downtrend line.
We’ll see if it continues to rally — maybe to 30.00 or even 33.00 — but there is a lot of overhead price supply, so that could be quite a long shot. I’d like to see Money Flow firm up on any further advancement, as that indicator is currently in downtrend on this longer timeframe.


