Slope of Hope Blog Posts

Slope initially began as a blog, so this is where most of the website’s content resides. Here we have tens of thousands of posts dating back over a decade. These are listed in reverse chronological order. Click on any category icon below to see posts tagged with that particular subject, or click on a word in the category cloud on the right side of the screen for more specific choices.

Bullion Buffoon

By -

It wasn’t that long ago that when I felt like it was a good time to buy gold (that is, real gold you could hold in your hands), I would go out and buy some. But after a while, gold wouldn’t be doing that well, and I’d sort of realize that there was really no scenario in which it would be useful to me (e.g. there would never come a day that everyone was starving since Whole Foods would ONLY accept gold, and I’d be able to feed my family due to my good planning). So I’d dump it.

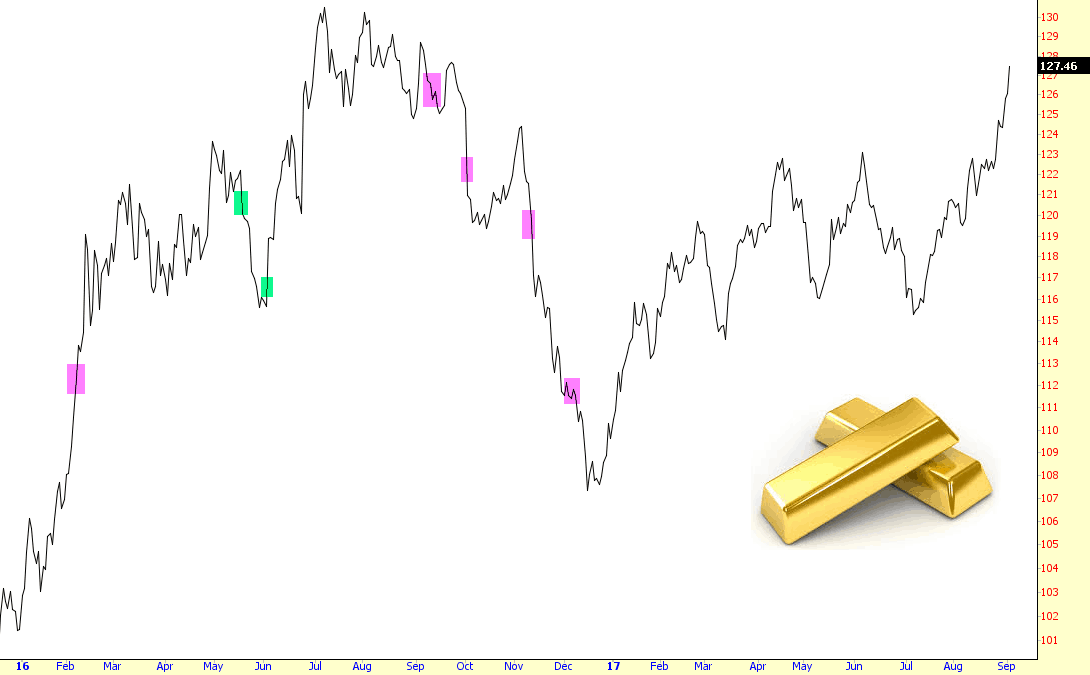
I thought I’d show when I bought and sold bullion, thinking it would reveal Gartman-like levels of bad timing. It turns out it wasn’t THAT bad. It was sort of bad – – buffoon level, I guess – – but nothing horrendous. Below I marked in green the buy points and in magenta the sell points.

0905-gold

(more…)

Oh, Those GPUs….

By -

OK, at the moment, I have nothing to say – – but we need a comment cleaner! So I’ll just toss in this cute little SlopeChart to show the correlation between BitCoin and Nvidia. There are a handful of firms which make GPUs, Nvidia being the big swinging dick of the lot, and this chipmaker’s fortune is tied tightly to bitcoin’s. With the nearly 20% smackdown $BTC suffered during the weekend, it’s not that shocking Nvidia would take it on the chin.

0904-gpubit

If I think of anything non-idiotic to write, I’ll do so later tonight.

S&P 500 Index: Momentum is Waning

By -

The momentum and rate of change indicators have been making a series of lower highs since July 2016 on the Weekly timeframe of the SPX, as shown below. Price has been climbing along the underbelly of a trajectory (beginning in August 2015) set from the 2009 lows to this year’s highs, as shown on the following Monthly chart.

This is the reality, as the next major (potentially) catastrophic and costly storm (Hurricane Irma) is predicted to hit the U.S. in the next few days. Add this fact to the latest provocations by North Korea, as well as to a gridlocked and divided Congress, along with stagnant wage growth, and it’s difficult to endorse sound reasons for a higher stock market in the coming days/weeks.

(more…)

Under the Line

By -

Today is going decently so far. I’ve got three October put positions (XRT, AMZN, IWM) which are doing decently, and my short equity portfolio is overall showing a profit. I’m quite light right now, having started the day with 25 positions and currently at 39 (for me, “heavy” is like 80 positions). The uptrend on the ES seems quite plainly broken, and we are obediently remaining beneath the now-broken trendline. Overall, a mellow day.

0905-es (more…)