
The bears may have just shown up (finally!) for the stock indices, but they began their damage more than a year ago in bonds and the dollar.
And that carnage in the dollar index may see a further move lower. (As always, click the image for a much bigger picture).
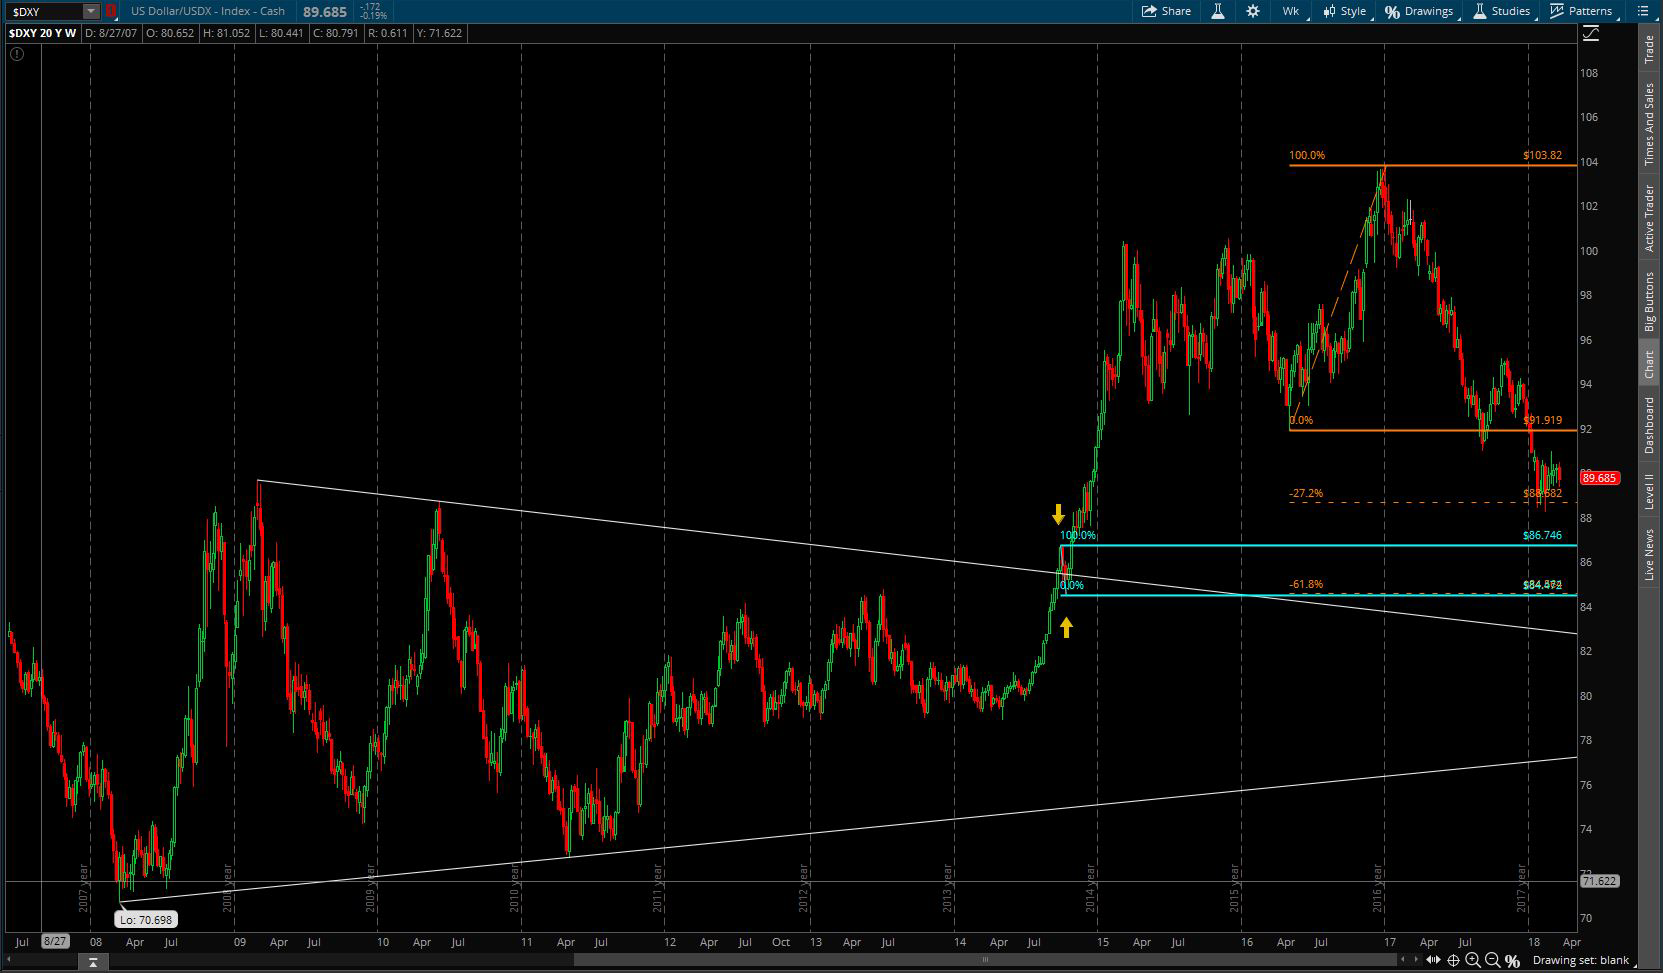
Behold the area of confluence on the dollar index weekly chart ($DXY via thinkorswim).
The area between 84.472 and 86.746 formed a two-week pullback following the breakout of a six-and-a-half YEAR wedge consolidation. The move that followed ramped the dollar up to highs not seen since Christmas of 2002!
But since the calendar flipped to 2017, the bears declared game on!, and flipped the trend on the dollar index to bearish by not only breaking and closing beneath the 2016 low, but then allowing a small relief rally, and re-crushing Kudlow’s “king dollar” to a new structure low.
So far in 2018 we’ve made one point of confluence on the way down, predicted by the fibonacci inversion technique.
That technique states that when a prior swing trend is violated, draw a fibonacci line from the prior high to low (or low to high for bullish rotations), then identify the 1.272 and 1.618 extensions.
You’ll note that the bears ran the dollar straight down into that 1.272 level at 88.682, and we’ve consolidated since.
The next level lower is the 1.618 inversion at 84.564, which just so happens to nearly exactly match up the bottom of the two-week pullback zone from the major wedge breakout. It also lines up with multiple prior weekly high candles from 2013, a key weekly top tail doji from 2005, and a key low from 2004.
That qualifies as a major area of confluence some a technical analysis standpoint.
