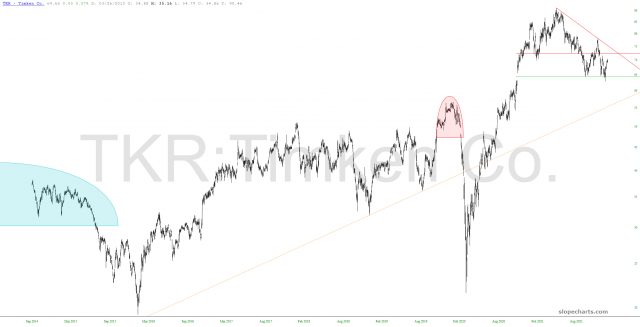
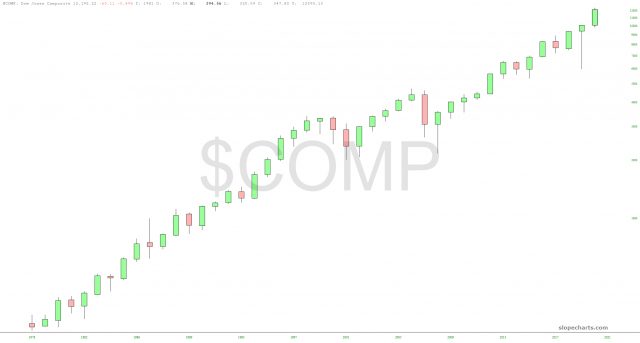
Of the many lines one can place on a chart, the objective is to help determine price movement – what is most likely to happen next – in an effort to execute a profitable trade.
Trend lines can be placed on a chart to show an uptrend or downtrend.
Horizontal lines can be placed based on high and low prices, on fibonacci retracement levels, and to note price gaps. Chart patterns, such as triangles, wedges and pennants, can be drawn by the chartist. All of these lines drawn are meant to offer support and resistance levels.
Whatever annotations we place on a chart they are an effort to assess the probabilities of a directional move in price. Assessing price action is based on maintaining or breaking support or resistance. Breaking support or resistance lines may well indicate a change of price direction [false breakouts notwithstanding].
(more…)

