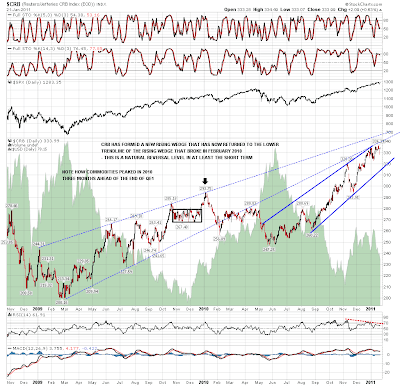
I've been mentioning for a while that we're in an area where we could see a very major commodities top, and I'm aware that my view is at best a minority view, but I'd like to put the case anyway, and to stress that I'm seeing this from the perspective of an chartist who mainly calls reversals on the basis of trendlines, and to show how impressive some of the trendlines are that commodities have recently reached and, so far, reversed at. I can only show a few of the commodities here so I've chosen copper, silver, oil as three of the most influential individual commodities and CRB to represent the commodities complex as a whole.
First the CRB, where the index has reached the lower trendline of the rising wedge that broke down in February 2010. It has also hit the upper trendline of the more recent rising wedge and is showing strong negative divergence on the daily RSI. At this level I would expect to see at least a retracement to the lower trendline of the rising wedge, and if that should break, considerably more. It's also worth noting that in 2010, CRB peaked almost four months ahead of equities:
The next three charts are much longer term charts. The first is the copper chart, where a major long term rising trendline has been reached. The trendline could be hit again short term, but unless we are to see a massive resistance break then that trendline represents the likely high for this move up, and I'd expect to see a move at least to the lower trendline of the shorter term rising channel soon:
The resistance level reached on silver is even more impressive, and the shorter term charts are indicating a retracement back to the 25 level here, and if that level turns out to be an H&S neckline, which it might, then perhaps much further after a bounce there:
The trendline hit is less definitive on oil, but it has hit two significant looking trendlines in recent days, and we may well see a reversal on oil too. It might break up through back into bubble territory of course, but the low stocks and tight production capacity over demand that fed the 2007/8 spike simply isn't there any more, and on that basis, this is a natural reversal level for a substantial retracement:
Commodities are also a currency story as well of course, and on the commodity currencies we saw a major trendline support break on AUDUSD this week. At that break it has formed a very characteristic reversal H&S with negative divergence on RSI, and I'm looking for a retracement to test the important support level at 94 if this continues to play out. It would make sense if that took place within a sharp correction on commodities generally, as the prospects for USD aren't looking promising generally at the moment, in which case any such decline would be likely to be commodity related:
Quantitative easing has fed this boom in commodities, and commodities peaked months before the end of QE1 in late March 2010. QE2 isn't finishing until June 2010, but it may well be that commodities are peaking further before this time. On the longer term charts the real question is whether there will be a QE3, and that is open to doubt.
The Republicans won't be keen, and there would most likely in any case be a gap of several months between the end of QE2 and the announcement of QE3 during which, if 2010 is any guide, we would expect to see equities and commodities tank while bonds soar. If commodities have peaked now, that means that we could well see a ten or twelve month period now where commodities retrace some of their gains in the last two years. In the event that there is no QE3, it might last considerably longer.


